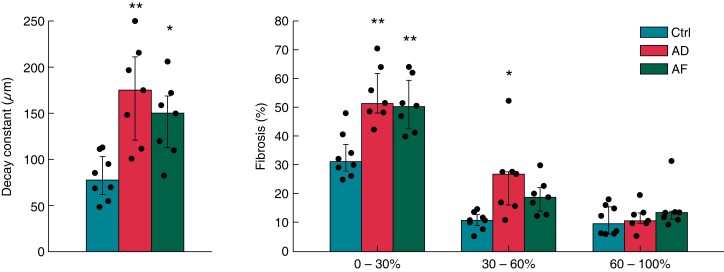
Figure 5.
Characteristics of transmural fibrosis in control (ctrl, n = 8), atrial dilatation (AD, n = 7), and atrial fibrillation (AF, n = 7; one patient was excluded due to the incomplete fibrosis profile) patients. Fibrosis spatial decay constant (right) and fibrosis content (left) in subepicardial (0–30% depth), midwall (30–60% depth), and subendocardial layers (60–100% depth) in the three patient subgroups. *P < 0.05 vs. control. **P < 0.01 vs. control). Bars indicate median values and whiskers interquartile values.

