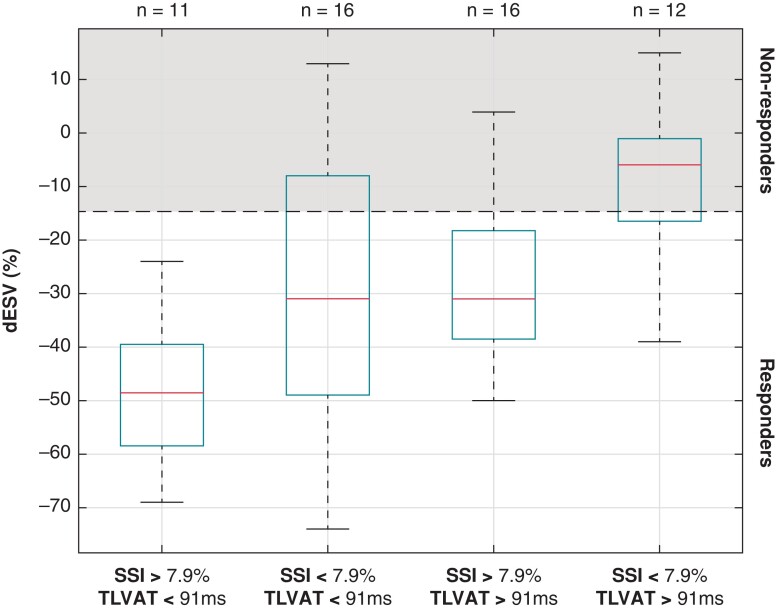
Figure 3.
Overview of in left-ventricular end-systolic volume change (ΔESV) in patients grouped according to the systolic stretch index (SSI) and total left-ventricular activation time (TLVAT) with respect to the median values observed in the study population. The central mark in the box indicates the median, and the bottom and top edges of the box indicate the 25th and 75th percentiles, respectively. The whiskers extend to the most extreme data points not considered outliers.

