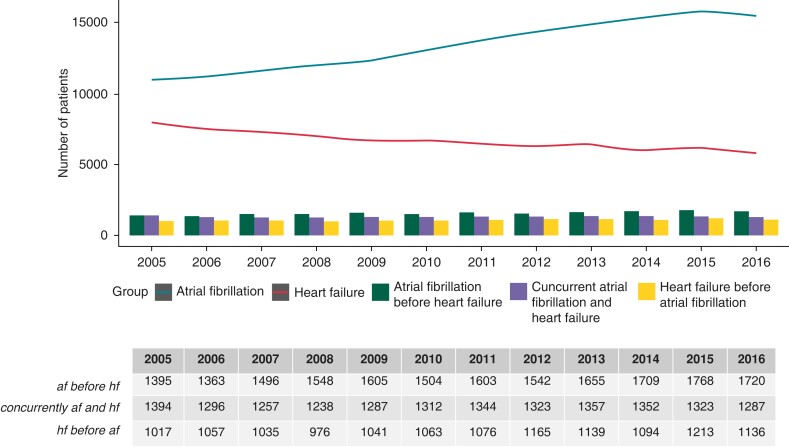
Figure 1.
Incidence of atrial fibrillation, heart failure, and temporal relations. Lines represent incidence of atrial fibrillation alone and heart failure alone per year. The bar chart represents number of patients with both atrial fibrillation and heart failure; divided by which condition came first or if they occurred concurrently.

