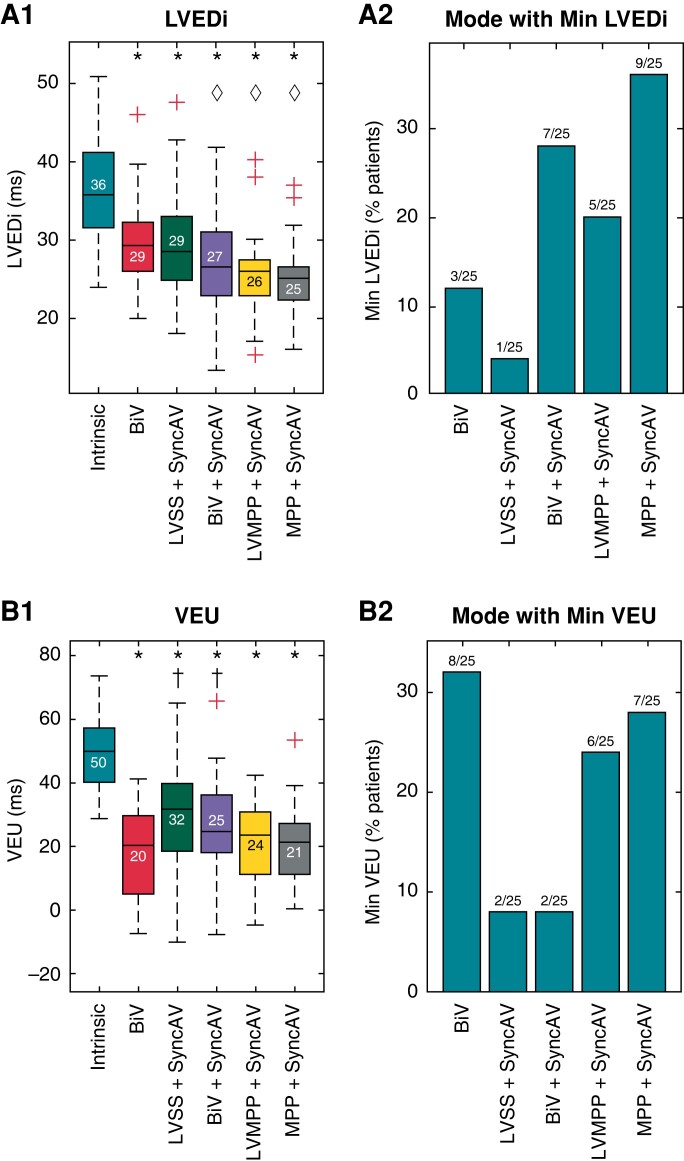
Figure 4.
Electrocardiographic imaging (ECGi) metrics of dyssynchrony for intrinsic conduction and each pacing mode. (A) LVEDi and (B) VEU panels show box plots of absolute values and bar graphs of proportion of patients in which each mode delivered the minimum value. LVEDi, left ventricular dispersion index; VEU, ventricular electrical uncoupling index; all other plot characteristics, abbreviations, and symbols follow Figure 3.

