图 4.
Feature analysis
特征分析
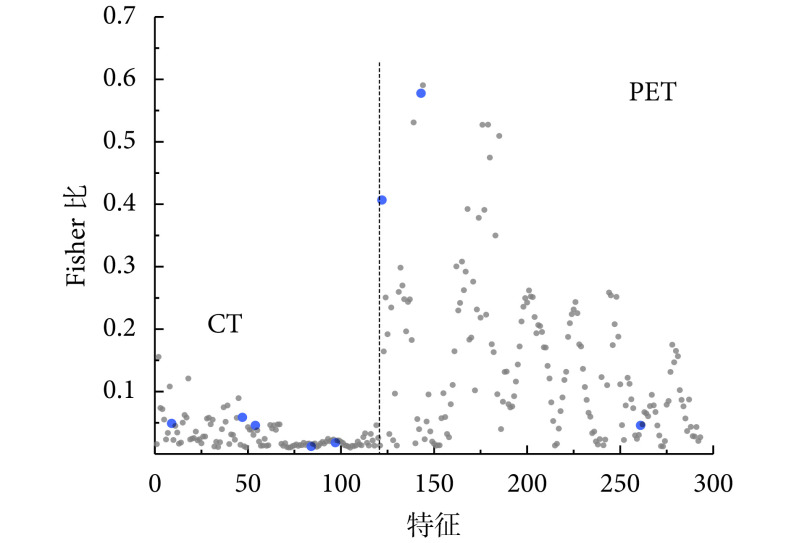
gray points represents the 293 features selected by the Fisher criterion; blue points represents the 8 features selected by the SFFS-SVM algorithm, from left to right: GLCM-based cluster shade, NGTDM-based strength, GLSZM-based small zone low gray level emphasis, and multi-resolution gray histogram’s 26th and 46th feature for CT image; SUVmax, GLDS based angular second-order moment and multi-resolution gray histogram’s 90th feature for PET image; the corresponding Fisher ratios are 0.049 0, 0.058 7, 0.045 9, 0.012 2, 0.018 1, 0.406 8, 0.577 7, 0.045 9, respectively
灰点表示 Fisher 准则选出的 293 个特征;蓝点表示 SFFS-SVM 特征选择算法选出的 8 个特征,自左至右依次为:CT 图像的基于 GLCM 的聚块阴影度、基于 NGTDM 的纹理强度、基于 GLSZM 的小区域低灰度因子、多分辨率灰度直方图的第 26 和第 46 个特征,以及 PET 图像的 SUVmax、基于 GLDS 的角度方向二阶距和多分辨率灰度直方图的第 90 个特征,相应的 Fisher 比依次为:0.049 0,0.058 7,0.045 9,0.012 2,0.018 1,0.406 8,0.577 7,0.045 9

