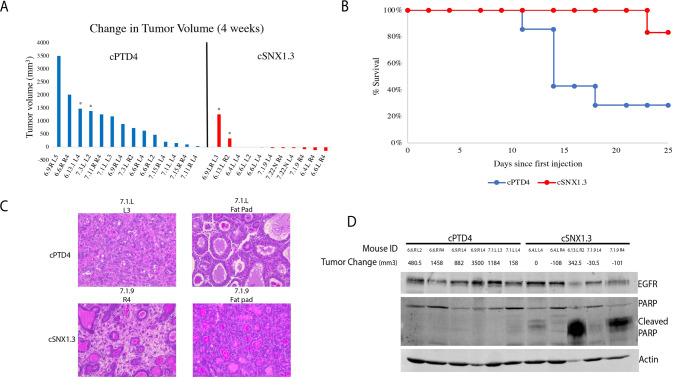
Fig. 2. cSNX1.3 driven tumor regression in WAP-TGFα transgenic mice.
Mice were bred continuously to induce transgene expression and palpated weekly for tumor formation. Once tumors reached 100 mm3, mice were entered into the study and given 10 µg/g body weight intravenous injections of either cPTD4 or cSNX1.3 3X/week. A Changes in tumor size from entry into study until end of study are shown for each individual tumor, (*) indicate tumors that entered the study at size greater than 500 mm3, all other tumors entered the study at ~100 mm3. B a Kaplan-Meier survival curve was generated showing when mice were sacrificed by either reaching tumor burden (2000 mm3) or the end of the study (p = 0.0002). C Upon sacrifice tumors were harvested and fixed in 10% formalin and embedded in paraffin. FFPE blocks were sectioned at 4 μM and stained with hematoxylin and eosin and imaged at 20x. D Protein lysates were generated from tumors upon the sacrifice and probed for the indicated proteins.

