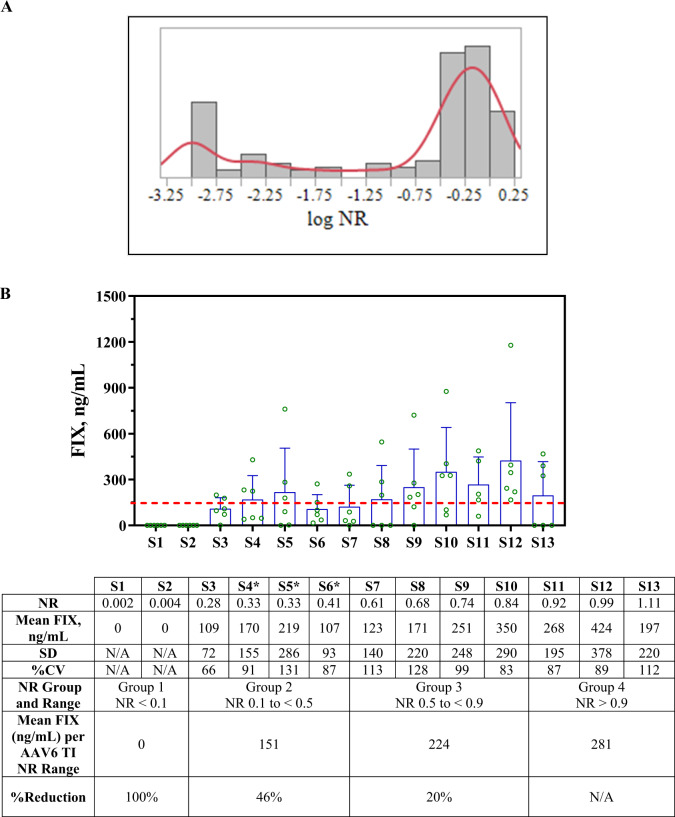
Fig. 1. Donors response in TI assay and in vivo mouse passive transfer study.
A 158 donors were evaluated in the AAV6 TI assay. Histogram was evaluated using JMP 14.2.0. Each bar represents a log NR bin size of 0.25 on the x-axis with number of donors in y-axis. Red line represents a smooth curve fit of data set (B) A total of 13 individual human serum samples, with AAV6 TI assay results ranging from 0.002 to 1.11, were tested in three separate mouse passive transfer studies. C57BL/6 mice (6 mice per donor except S11 which only has 5) were administered serum (200 µL) and AAV6 hF9 cDNA (200 µL) at 6e10 vg/mouse via IV injection on Study Day 0. hFIX levels in plasma were measured by ELISA at Day 7 (donor with *) or Day 10 post-dosing. Each bar represents the mean plasma FIX levels from tested animals with each animal represented by an open circle, error bars indicate SD; dashed horizontal line at 150 ng/mL FIX indicates efficacious level (3% of FIX activity in healthy individuals) per literature. % Reduction in FIX level was calculated based on three NR groups (Group 1 NR < 0.1, Group 2 NR 0.1 to <0.5, and Group 3 NR 0.5 to <0.9) relative to the mean FIX level from animals treated with sera with NR > 0.9 (Group 4).

