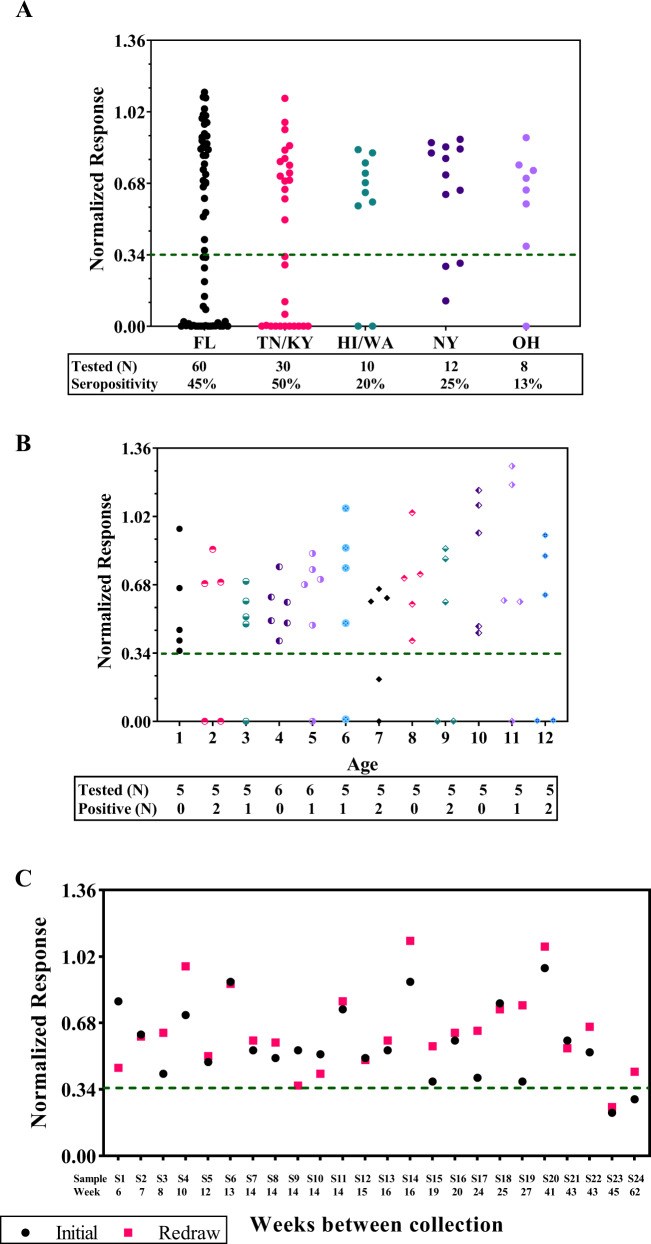
Fig. 2. AAV seroprevalence and seroconversion.
A Samples from a total of 120 healthy donor from different regions within the United States were evaluated. Each dot represents the normalized response (NR) from a donor. The green dashed line represents a clinical cutoff of 0.34. FL Florida, TN Tennessee, KY Kentucky, HI Hawaii, WA Washington, NY New York, OH Ohio, N Number. B Samples from a total of 62 pediatric donor with ages ranging from less than 1 to 12 were evaluated. Each dot represents the NR from a donor and each age group with a different symbol. The green dashed line represents a clinical cutoff of 0.34; N = Number. C 24 subjects across different clinical trials had blood re-drawn and reanalyzed during screening period. Black dots represent the initial analysis and magenta squares represent the analysis from a new blood collection. The green dashed line represents a clinical cutoff of 0.34.

