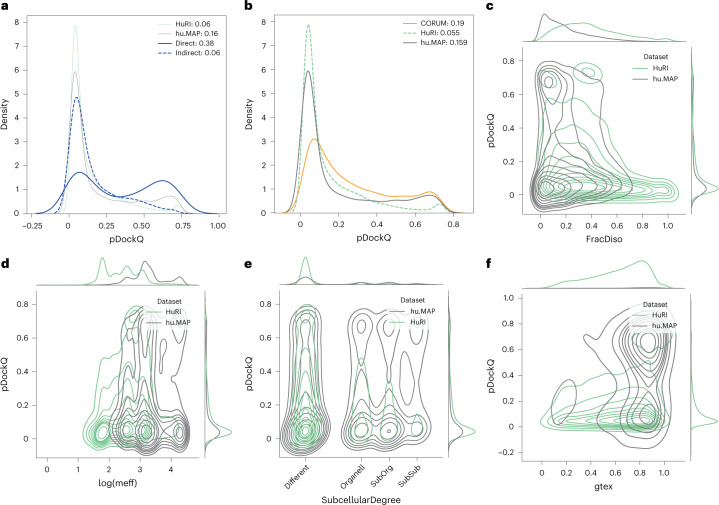
Fig. 2. Protein and interaction features impacting on prediction confidence: analysis of different datasets.
In all subfigures, proteins from HuRI in green, hu.MAP gray, CORUM orange and from large PDB complexes blue. a, pDockQ values of directly and indirectly interacting proteins from the same complex (blue); for comparison, HuRI and hu.MAP data are shown with thin lines. b, pDockQ values of CORUM (orange), HuRI (green) and hu.MAP (gray) datasets. c, Fraction of residues predicted to be disordered (pLDDT < 0.5) shows that protein pairs in HuRI are enriched in disorder. d, Proteins in HuRI have fewer sequences in the paired MSAs as measured by the mean number of efficient sequences in the MSA (meff). e, Proteins that share subcellular localization (solid lines) are enriched in high pDockQ scores in all three datasets. f, Only protein pairs in hu.MAP are coexpressed according to STRING, using similarity in Genotype-Tissue Expression (gtex), and coexpressed pairs are enriched in pairs with high pDockQ scores.

