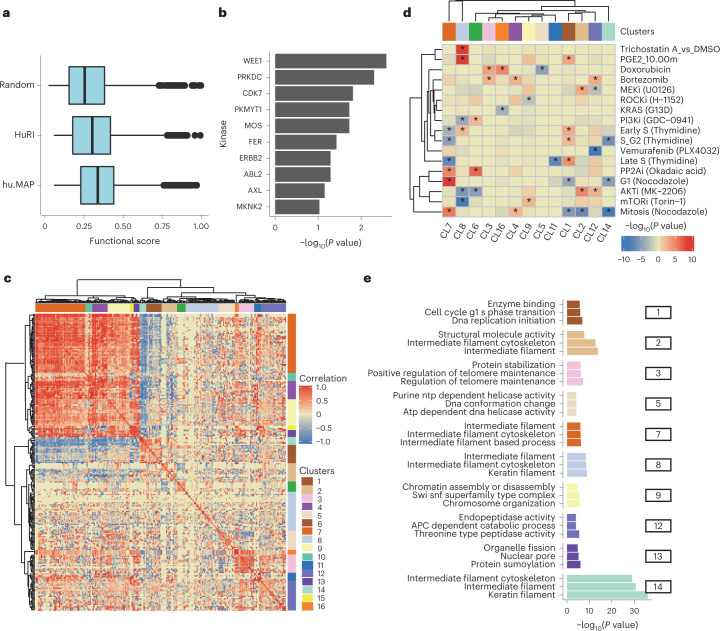
Fig. 5. Co-regulation of phosphorylation sites at interface residues.
a, Distribution of phosphosite functional scores for phosphosites at interface residues and random phosphosites. The min, mean and max values were as follows: Random = 0.02, 0.26, 0.98; HuRI = 0.06, 0.37, 0.99; hu.MAP = 0.06, 0.33, 0.99. The boxes represent the first and third quartiles. The upper whisker extends from the third quartile to the largest value no further than 1.5 × IQR. The lower whisker extends from the first quartile to the smallest value at most 1.5 × IQR. b, Enrichment of kinase substrates among phosphosites at interface residues. The P value was derived from an over-representation analysis using a one-sided hyper-geometric test (N = 7,150). c, Hierarchical clustering of the pairwise correlation values for changes in phosphosite levels across conditions. Groups of phosphosites showing high correlation values were defined as clusters (1 to 16), as indicated in colors along the outside of the clustergram. d, Degree of regulation of phosphosites from each cluster in a select panel of conditions, defined by a one-sided Z-test comparing the fold change of the phosphosites in a cluster compared with the entire distribution of fold changes in that condition. The result is summarized as the −log(P value), and signed as positive if the median value is above the background or negative otherwise. e, Gene ontology enrichment analysis for the proteins with phosphosites annotated to select clusters.

