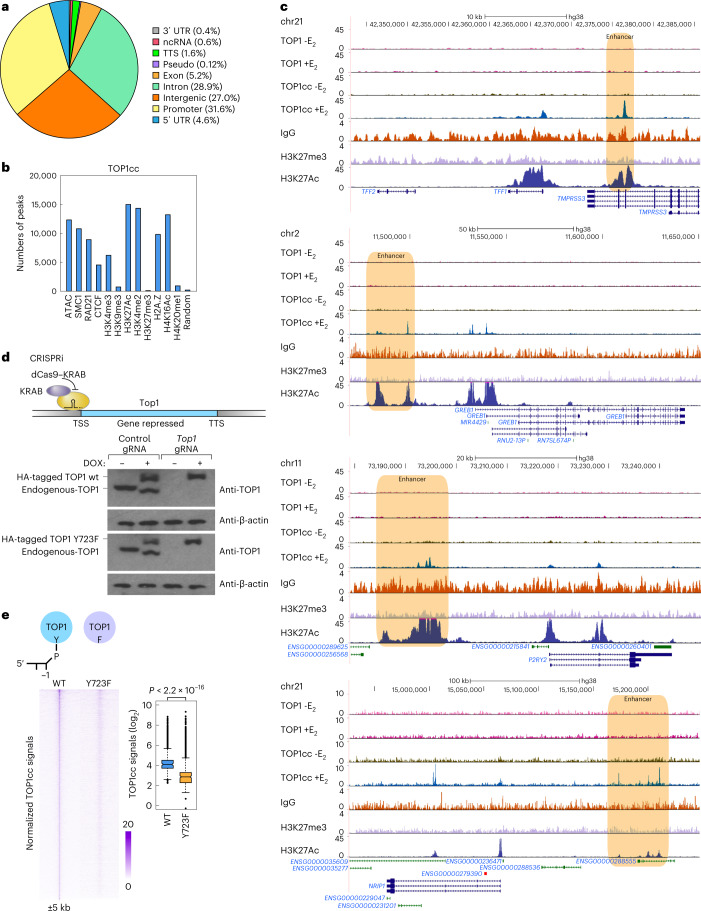
Fig. 1. TOP1cc is presented at signal-induced active enhancers.
a, Pie chart shows the genome-wide distribution of TOP1cc CUT&RUN signals in E2-treated MCF7 cells. b, Numbers of TOP1cc-enriched regions at ATAC–seq peaks, ChIP–seq peaks of enhancer-related marks (H3K4me2 and H3K27Ac), additional chromatin marks at accessible regions (H3K4me3, H4K16Ac, H2A.Z, SMC1, RAD21 and CTCF), chromatin silencing marks (H4K20me1, H3K27me3 and H3K9me3) and 179,220 random selected genomic regions in E2-treated MCF7 cells. c, Genomic browser images show the TOP1cc CUT&RUN signals, Top1 and H3K27Ac ChIP–seq signals at selected gene loci. IgG and H3K27me3 CUT&RUN signals are serving as the experimental controls for the CUT&RUN assays. Enhancers are highlighted with light-brown boxes. d, Western blots show the expression of BLRP-tagged wt and Y723F enzymatic dead mutant Top1 in MCF7 cells. Endogenous Top1 was inhibited with dCas9-KRAB, and wt and Y723F enzymatic dead mutant Top1 were expressed using DOX; three biological replicates. e, TOP1cc signals (n = 18,308) in E2-treated BLRP-tagged wt- and enzymatic dead mutant Top1-Y723F-expressing MCF7 cells detected by CUT&RUN assays are shown with heatmaps. An additional 5 kb from the center of the peaks is shown, and the color scale shows the normalized tag numbers. Center lines show the medians, box limits indicate the 25th and 75th percentiles and whiskers extend 1.5× the interquartile range from the 25th and 75th percentiles. P value generated from unpaired two-tailed t-test denotes statistical differences between wt and Y723F conditions. Uncropped images for d and data for graphs in b are available as Source data.

