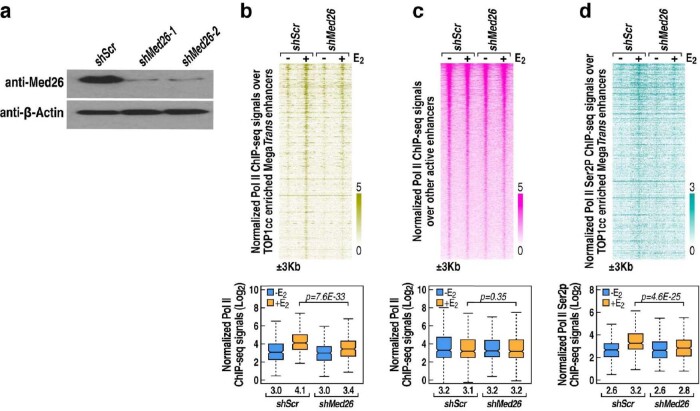
Extended Data Fig. 9. Med26 is involved in the transcriptional activation at enhancers.
(a) Western blots show the expression of Med26 protein upon the knock-down of Med26 with shRNAs. (b) Heatmaps and box-and-whisker plots show Pol II ChIP-seq signals and PolIISer2p ChIP-seq signals at TOP1cc-enriched MegaTrans enhancers (n = 481). (c) Heatmaps show Pol II ChIP-seq signals at other active enhancers (n = 3,533). (d) Heatmaps and box-and-whisker plots show PolIISer2p ChIP-seq signals at TOP1cc-enriched MegaTrans enhancers (n = 481). For b, c and d, additional 3 kb from the center of the peaks are shown, and the color scale shows the normalized tag numbers. For b, c and d, P values generated from unpaired two-tailed t test denote statistical differences between shSrc and shMed26 under E2 conditions in the box-and-whisker plots. Center lines show the medians, box limits indicate the 25th and 75th percentiles, and whiskers extend 1.5× the interquartile range from the 25th and 75th percentiles. The median values of normalized Pol II ChIP-seq tags (Log2) are listed under the boxplots. Uncropped images for a are available as source data.

