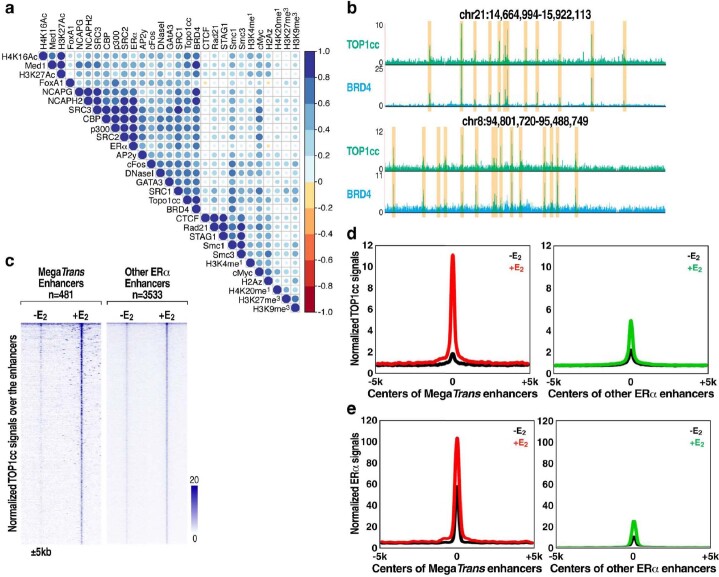
Extended Data Fig. 2. TOP1cc is associated with transcriptional activation at ERα marked active enhancers.
(a) Pearson correlation between TOP1cc CUT&RUN signals with histone modifications, coactivators and other signals at the active enhancers in E2 treated MCF7 cells was plotted. (b) Genome browsers show TOP1cc CUT&RUN signals and BRD4 ChIP-seq signals at the selected loci in E2 treated MCF7 cells. TOP1cc and BRD4 overlapped regions are highlighted with light-brown boxes. (c) Heatmaps show TOP1cc CUT&RUN signals and ERα ChIP-seq signals at ERα marked robustly activated MegaTrans enhancers (n = 481) and ERα marked non MegaTrans enhancers (n = 3,533). Additional 3 kb from the center of the peaks are shown, and the color scale shows the normalized tag numbers. (d, e) Histogram plots show TOP1cc CUT&RUN signals (d) and ERα ChIP-seq signals (e) at ERα marked robustly activated MegaTrans and non MegaTrans enhancers. Additional 5 kb from the center of the peaks are shown, and the color scale shows the normalized tag numbers.

