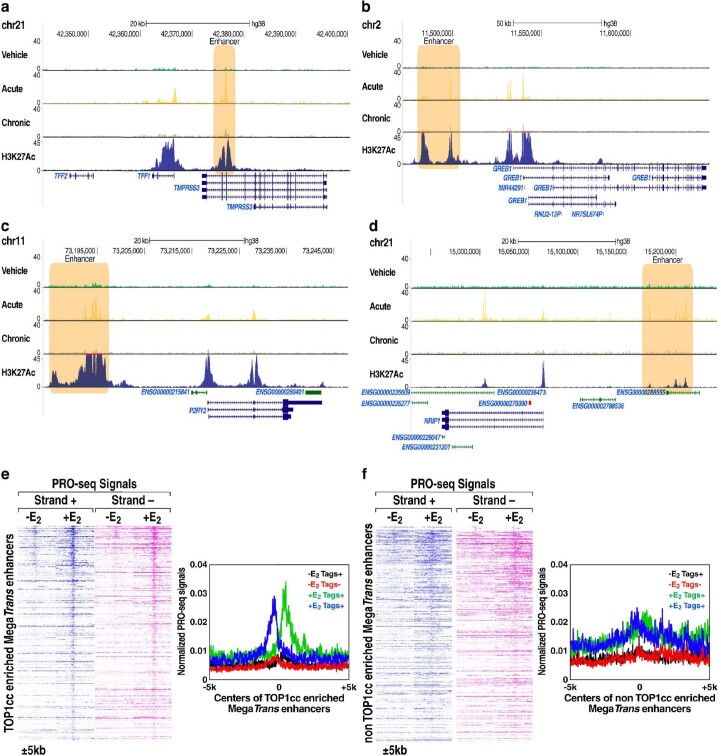
Extended Data Fig. 4. Enhancer RNAs are highly expressed at TOP1cc-enriched MegaTrans enhancers.
(a~d) Genomic browsers show TOP1cc CUT&RUN signals and H3K27Ac ChIP-seq signals at the selected enhancers upon acute E2 (1 hr) treatment and chronical E2 (~14 hrs) treatment. Enhancers are highlighted with light-brown boxes. (e) Heatmaps and histogram plots show PRO-seq signals at TOP1cc-enriched MegaTrans enhancers. Additional 3 kb from the center of the peaks are shown, and the color scale shows the normalized tag numbers. (f) Heatmaps and histogram plots show PRO-seq signals at nonTOP1cc enriched MegaTrans enhancers. Additional 3 kb from the center of the peaks are shown.

