Figure 1.
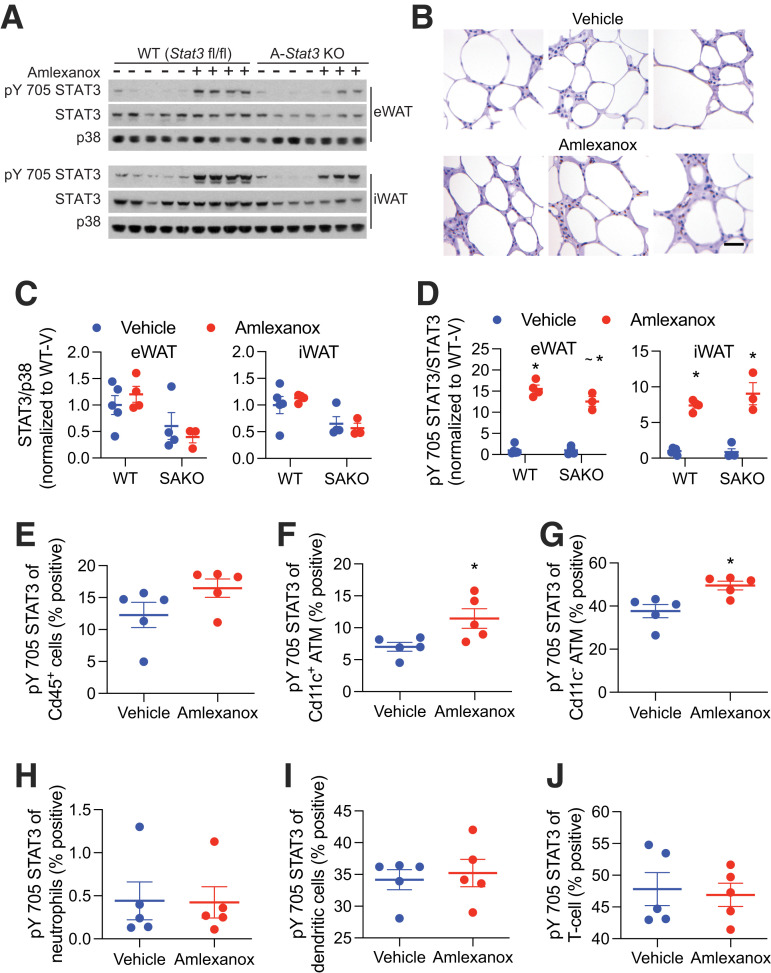
STAT3 phosphorylation in adipose cells after amlexanox treatment. Experiments were performed 4 h after gavage with 25 mg/kg amlexanox or vehicle control in obese male mice aged 20–24 weeks. A: Western blot analysis of STAT3 and pY705 STAT3 in epididymal (eWAT) and inguinal WAT (iWAT) of Stat3 adipocyte-specific KO (SAKO) mice and floxed littermate controls. B: Immunohistochemical analysis of pY705 STAT3 brown DAB staining. Slides were also stained with hematoxylin and eosin. Tissues were harvested and immediately fixed after 52 h of amlexanox treatment by daily oral gavage (n = 3 per treatment). Scale bar = 50 μm. C: Quantification of STAT3 over p38 levels in eWAT and iWAT. The effect of genotype is significant in both tissues at P < 0.01 by two-way ANOVA. D: Quantification of pY705 STAT3 over total STAT3 levels in eWAT and iWAT. *P < 0.05 vehicle vs. amlexanox within genotype; ∼P < 0.05 WT vs. KO within the treatment group. E–J: FACS analysis of the percent positivity for pY705 STAT3 in SVC populations (n = 5 per treatment): all Cd45+ immune cells (E); proinflammatory ATMs Cd45+, Cd64+, and Cd11cHigh (F); anti-inflammatory ATMs Cd45+, Cd64+, and Cd11cLow (G); neutrophilsCd45+ and Ly6G+ (H); dendritic cells Cd45+, Cd64−, and Cd11c+ (I); and T cells Cd45+ and Cd3+ (J). Statistical significance determined by post hoc analysis after significant two-way ANOVA. *P < 0.05 by Student t test vehicle vs. amlexanox. V, vehicle.

