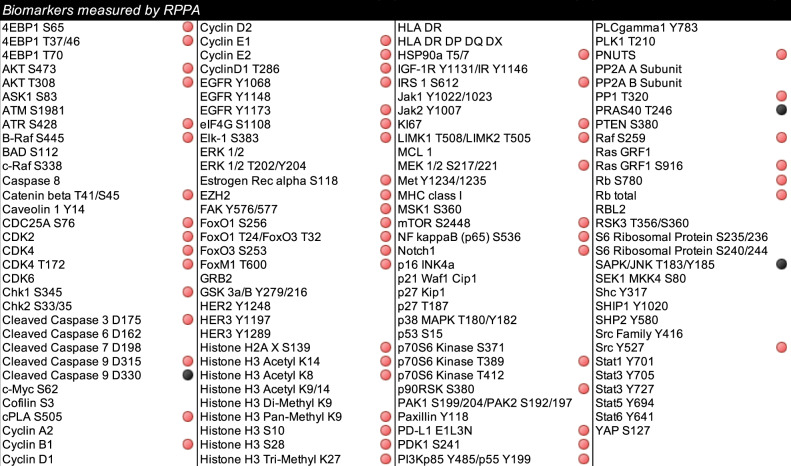
Table 2.
List of proteins that reached statistical significance when responders were compared to patients with progressive disease.
Samples were cross-classified as above/below median values. The chi-square test was used to compare biomarkers’ distributions in responders and non-responders. Red circles indicate proteins that in the comparison reached a p value <0.05 and black circles indicate proteins that in the comparison reached a p value <0.01.

