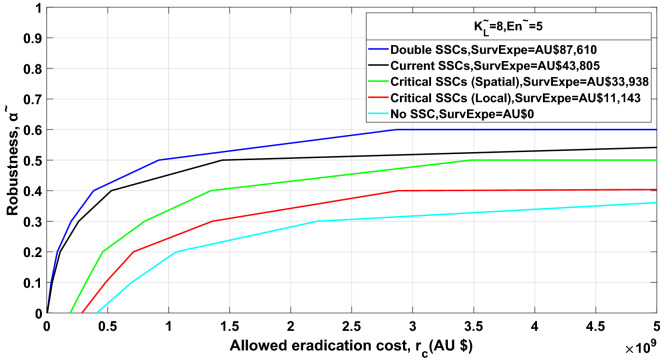
Figure 4.
Robustness curves for situations shown in the legend. In each situation, the population threshold for detection of Asian house gecko at each location is estimated at 8 (i.e. for ) and the annual number of entries of AHG individuals after border inspection to any of the locations on Barrow Island is estimated at 5 (). All lines, except for the red line (based on local spread model), are based on spatial spread model. The optimal allocation of Surveillance System Components (SSCs) in each zone at each location is denoted as ‘Optimal Spatial’. The application of double (200%) and no SSCs in each zone at each location is denoted as ‘Doubling Optimal Spatial’ and ‘No SSCs Spatial’ separately. The ‘Critical Spatial’ and ‘Critical Local’ are applied to meet Chevron’s ministerial requirements. The ‘SurvExpe’ indicates the corresponding estimated surveillance cost in each situation.

