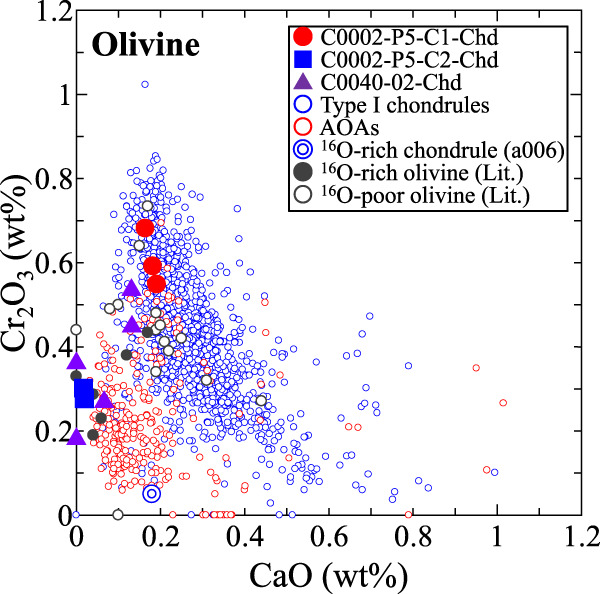
Fig. 4. Comparison of concentrations between Cr2O3 and CaO in olivine from the three chondrule-like objects in the Ryugu samples.

Concentrations of Cr2O3 and CaO in olivine from C0040-02-Chd are only from TEM-EDS data, as the EPMA data is mixture of olivine and diopside. Olivine data of type I chondrules and AOAs, which are plotted for comparison, are from type ≤3.0 chondrites10,16,17,21,36,37,42,43,45,46,49,51,55,56,71,80–86. Concentrations of Cr2O3 and CaO in olivine in the 16O-rich chondrule (a006) from a CH chondrite50 and those in 16O-rich and -poor olivine from the Ryugu samples and CI chondrites22–24,30,41 are plotted for comparison.
