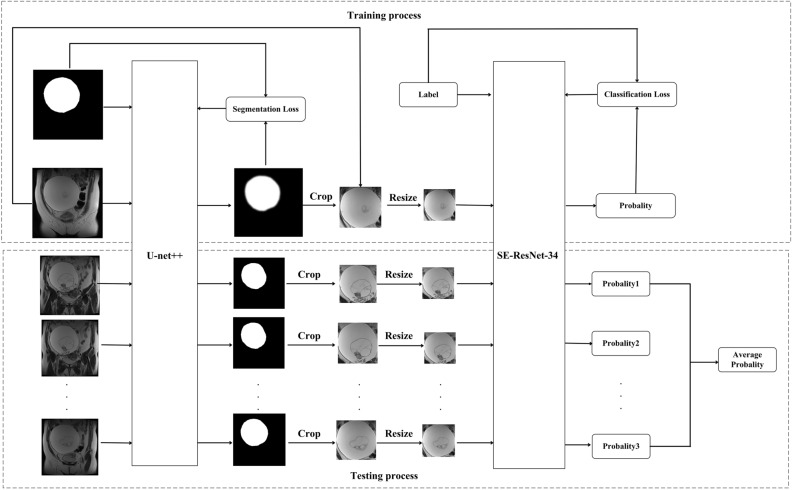
Figure 2.
Flowchart of the proposed method including training and testing processes. The U-Net++ model was used to segment ovarian tumor regions in the images. Then, we cropped and resized the segmented tumor region to 96 × 96 matrix size and fed resized patch into the trained SE-ResNet-34 model to get the probability of tumor in each slice being EOC. The probability of all slices containing tumor regions was averaged to get the case-based result.

