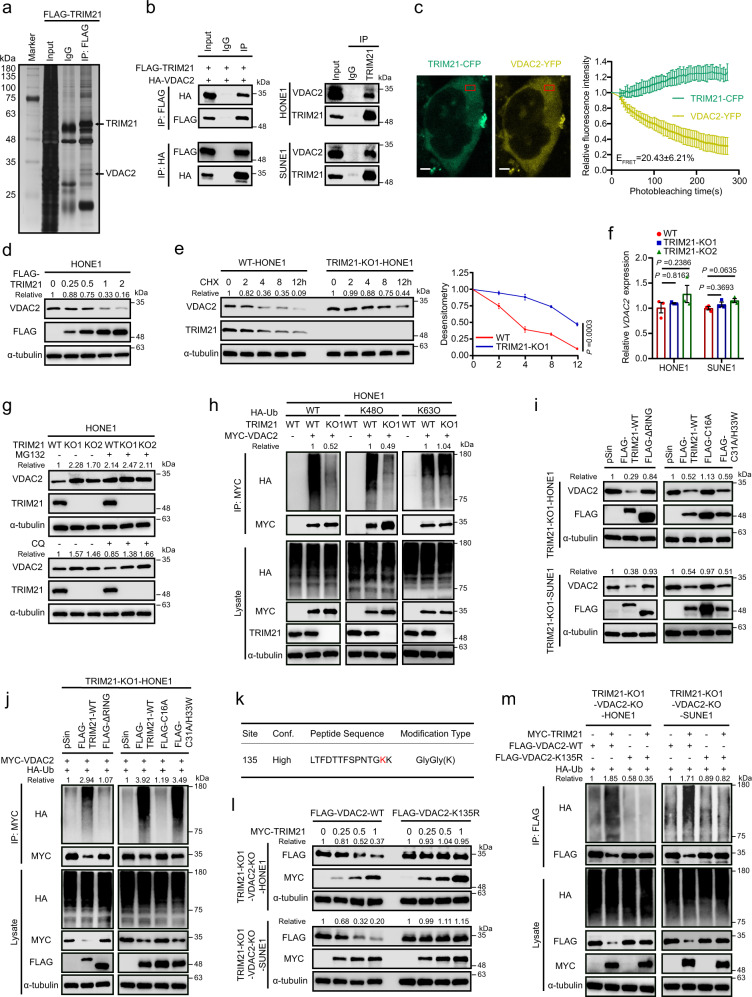
Fig. 3. TRIM21 promotes the degradation of VDAC2 by increasing its K48-linked ubiquitination.
a Silver staining of SDS–PAGE gels showed that the FLAG immunoprecipitates were pulled down from HONE1 cells overexpressing FLAG-TRIM21. The proteins of interest are indicated. b Left: Co-IP with an anti-FLAG (top) or an anti-HA (bottom) antibody revealed the interaction of exogenous TRIM21 and VDAC2 in HEK293T cells. Right: Co-IP with an anti-TRIM21 antibody in NPC cells revealed the interaction of endogenous TRIM21 and VDAC2. c FRET assay in HEK293T cells transfected with TRIM21-CFP and VDAC2-YFP. Representative cells with TRIM21-CFP and VDAC-YFP, and region of FRET analysis was indicated. The exponential decrease in VDAC2-YFP (acceptor) fluorescence and the concomitant increase in TRIM21-CFP (donor) fluorescence during YFP-photobleaching were analysed in 20 cells. The FRET efficacy (EFRET) was reported. Scale bar, 5 μm. d VDAC2 protein level in HONE1 cells transfected with gradient concentrations of FLAG-tagged TRIM21. e Immunoblots (left) and corresponding greyscale analysis (right) of VDAC2 in WT and TRIM21-KO HONE1 cells treated with CHX for the indicated times. f VDAC2 mRNA expression in TRIM21-KO NPC cells. g VDAC2 protein level in WT and TRIM21-KO HONE1 cells after 6 h of treatment with MG132 (top) or CQ (bottom). h Ubiquitination level of exogenous MYC-VDAC2 in WT and TRIM21-KO HONE1 cells. i VDAC2 protein level in TRIM21-KO NPC cells transfected with vector, FLAG-tagged WT TRIM21 or three FLAG-tagged TRIM21 mutants. j The ubiquitination of MYC-tagged VDAC2 in TRIM21-KO HONE1 cells transfected with vector, FLAG-tagged WT TRIM21 or three FLAG-tagged TRIM21 mutants. k MS analysis of VDAC2 ubiquitination sites. l Protein levels of FLAG-tagged WT and K135R VDAC2 in NPC cells transfected with gradient concentrations of MYC-tagged TRIM21. m Ubiquitination of FLAG-tagged WT and K135R VDAC2 by MYC-tagged TRIM21. The results are representative of three independent experiments (a–j, l, m). The data are presented as the mean ± SEM (c, e). Comparisons were performed using two-way ANOVA (e) and one-way ANOVA with Tukey’s test for multiple comparisons (f).

