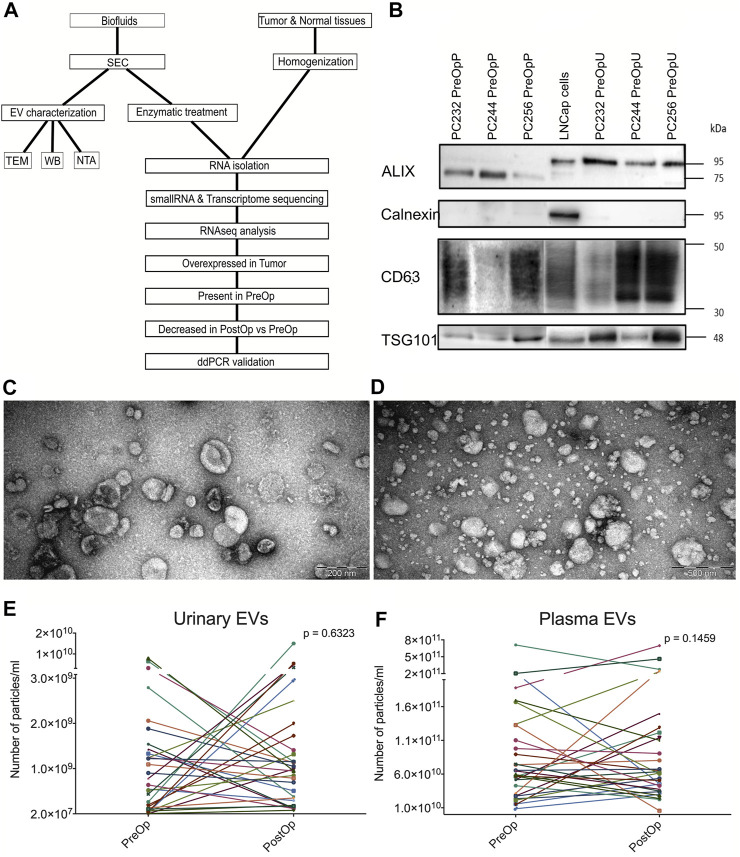
FIGURE 1.
EV isolation and characterization. (A) Workflow of the study. (B) Western blot of CD63, ALIX, TSG101 and calnexin in LNCaP prostate cancer cells and pre-operation urinary and plasma EVs from three different patients. (C) Representative TEM image of urinary EVs. (D) Representative TEM image of plasma EVs. (E) Paired dot plots showing the numbers of EVs per ml of urine before (PreOp) and after radical prostatectomy (PostOp). (F) Paired dot plots showing the numbers of EVs per ml of plasma before and after radical prostatectomy. Wilcoxon matched-paired signed rank test was used to assess the statistical significance of the differences between groups.

