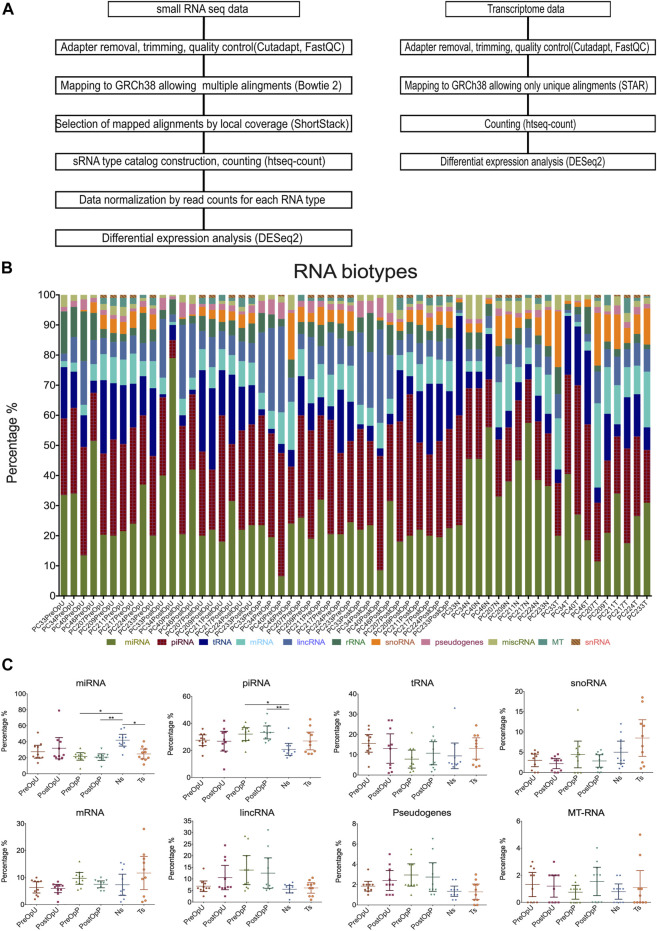
FIGURE 2.
RNA biotypes. (A) RNA sequencing data analysis pipeline. (B) Percentage of reads representing various RNA biotypes in each sample. (C) Dot plots showing the comparison of specific RNA biotypes in the groups of samples. Kruskal—Wallis test with multiple comparisons corrected by Dunn’s test was used to assess the statistical significance of the differences between groups. *p < 0.5; **p < 0.01; ***p < 0.001. PreOpU—urinary EVs before radical prostatectomy, PostOpU—urinary EVs after radical prostatectomy; PreOpP—plasma EVs before radical prostatectomy, PostOpP—plasma EVs after radical prostatectomy, N—normal prostate tissue, T—tumor tissue.

