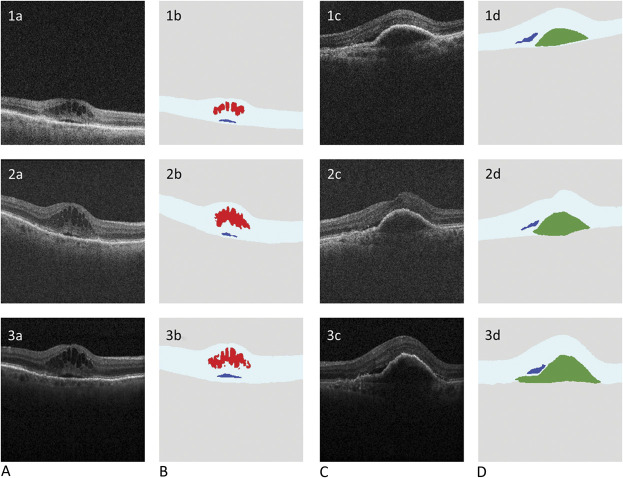
Fig. 2.
Rows 1, 2, and 3 show example home OCT, cirrus, and Spectralis images, respectively, all at approximately the same location. Columns A and C are the original OCT image. Columns B and D show their respective, automatic segmentations (akin to Figure 1, Column C). No ground-truth labeling of the clinical devices was performed, and these results are just shown for qualitative comparison.

