Figure 3.

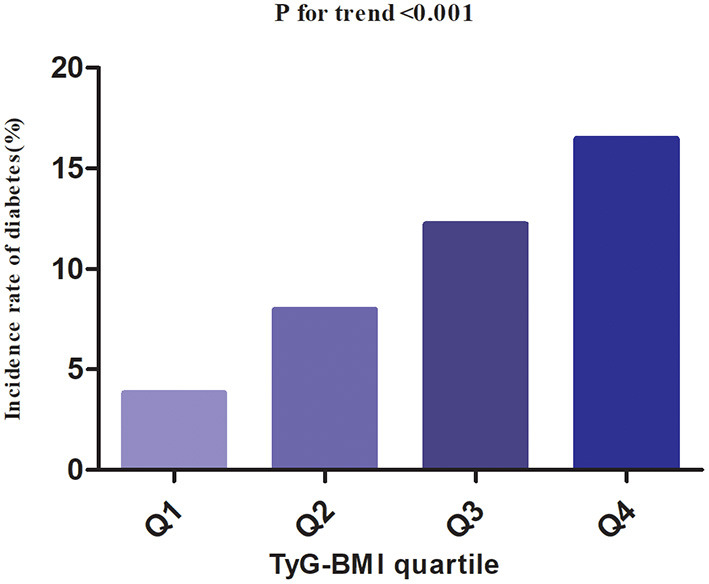
The incidence rate for diabetes according to the quartiles of TyG-BMI. Participants with the highest TyG-BMI(Q4) had higher diabetes incidence rates than those with the lowest TyG-BMI(Q1) (p < 0.001 for trend).

The incidence rate for diabetes according to the quartiles of TyG-BMI. Participants with the highest TyG-BMI(Q4) had higher diabetes incidence rates than those with the lowest TyG-BMI(Q1) (p < 0.001 for trend).