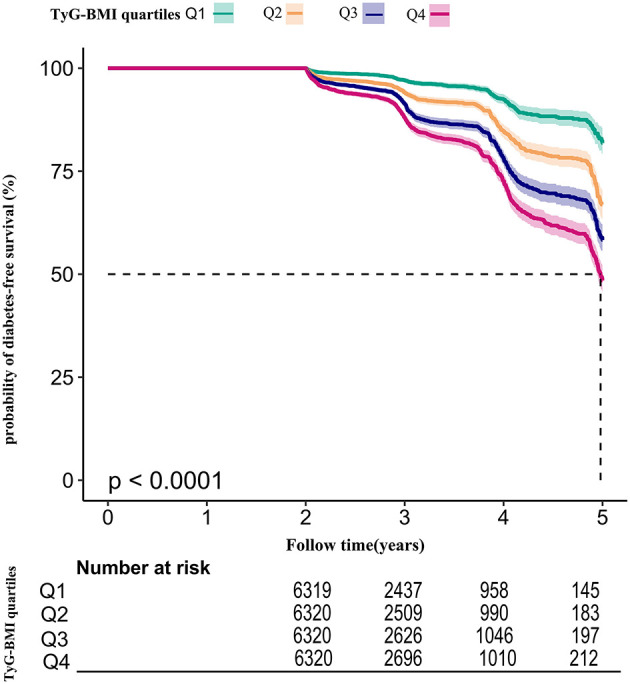
Figure 5.

Kaplan–Meier event-free survival curve. Kaplan–Meier event-free survival curve. The probability of diabetes-free survival differed significantly between the TyG-BMI quartiles (log-rank test, p < 0.001). The probability of diabetes-free survival gradually decreased with increasing TyG-BMI, suggesting that the group with the highest TyG-BMI had the highest risk of diabetes.
