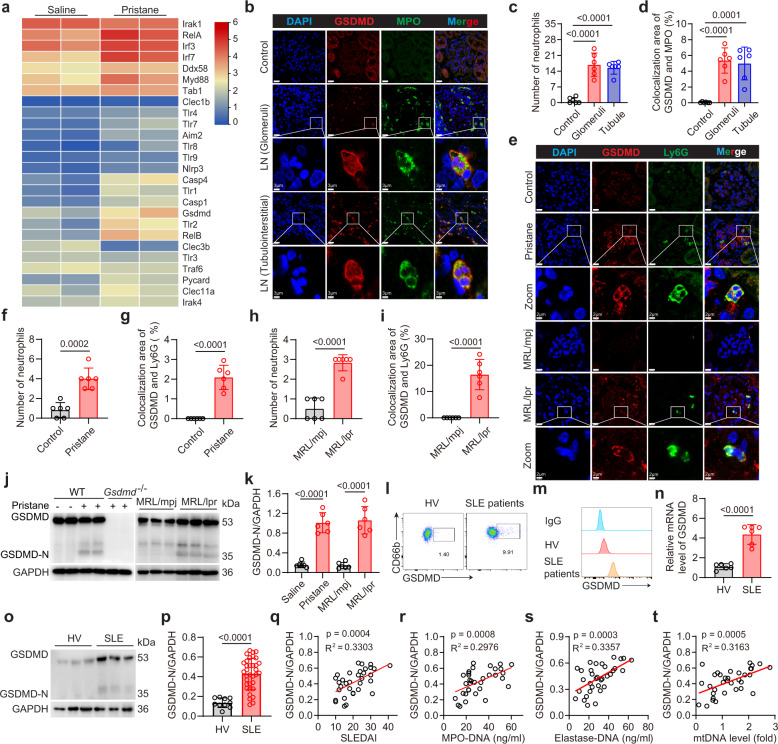
Fig. 1. GSDMD is activated in neutrophils from lupus mice and SLE patients.
a Heatmap of genes involved in DAMP sensing pathways that are differentially expressed between the kidneys of mice treated with saline and pristane. b Immunofluorescence staining for GSDMD and MPO in glomeruli and tubulointerstitial of renal biopsy from lupus nephritis (LN) patients. Scale bar, 20 μm, 3 μm (enlarged). c, d Quantitative analysis of numbers of neutrophils per field of view (FOV) or co-localization area of GSDMD and MPO in FOV. Tumor-adjacent normal tissue samples of 3 renal carcinoma patients or renal biopsies from 3 LN patients. The results are pooled from two independent experiments. e Immunofluorescence staining for GSDMD and Ly6G in kidney from PIL and MRL/lpr mice. Scale bar, 10 μm. 2 μm (enlarged). f–i Numbers of neutrophils or co-localization area of GSDMD and Ly6G per FOV. n = 6 mice. j Immunoblotting of GSDMD and GSDMD-N in bone marrow (BM) neutrophils from wide-type (WT), PIL, pristane-treated Gsdmd−/−, MRL/mpj and MRL/lpr mice. k Quantitative analysis of GSDMD-N/GAPDH. n = 6 mice. The samples shown are from the same experiment. Three blots (PIL group) and two blots (MRL/lpr group) were processed in parallel. l Flow cytometry plots for GSDMD in peripheral blood neutrophils from HV and SLE patients. m Fluorescence intensity of GSDMD from the isotype, HV and SLE groups. n mRNA levels of GSDMD in HV and SLE patients. n = 6 HVs or SLE patients. o Immunoblotting for GSDMD and GSDMD-N protein in peripheral blood neutrophils from HV and SLE patients. p Quantitative analysis of GSDMD-N/GAPDH. n = 10 HVs and n = 34 SLE patients. The samples shown are from the same experiment. Three blots were processed in parallel. Correlation of relative expression of GSDMD-N (the ratio of GSDMD-N to GAPDH from immunoblotting analysis) on neutrophils from SLE patients with SLEDAI (q), MPO-DNA complexes (r) elastase-DNA complexes (s) and mtDNA levels (t) in serum. Data are representative of two (b) or three (a, e, l, m, n) independent experiments. Data are presented as mean ± SD. Significance was examined by unpaired two-sided Student’s t test (f–i, k, n, p) or one-way ANOVA (c, d). Spearman’s nonparametric test for (q–t).

