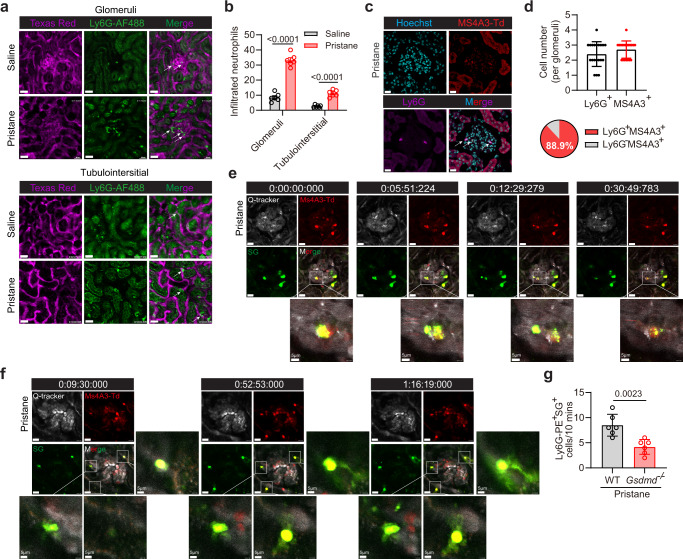
Fig. 2. Intravital renal microscopy reveals neutrophil cell death in live lupus mice.
a Two photon intravital imaging analysis of infiltrated neutrophils (Ly6G-AF488) in renal blood vessels (Texas Red) of live mice (glomeruli and tubulointerstitial) after saline or pristane treatment. Scale bar, 30 μm. b Quantitative analysis of infiltrated neutrophils in glomeruli and tubulointerstitial of mice after saline or pristane treatment. n = 6 mice. c Immunofluorescence staining of Ly6G in glomeruli from Ms4a3-tdTomato (Ms4a3-Td) mice after pristane treatment. Scale bar, 30 μm. d Quantitative analysis of Ly6G+ and Ms4a3-tdTomato+ cell numbers in each glomerulus and percentage of Ms4a3-tdTomato+ Cells. Representative of three independent experiments, and each point represents one glomerulus with the mean being represented by a horizontal line. e, f Intravital imaging of the kidneys from pristane-treated Ms4a3-Td mice revealing the release of DNA (Sytox Green, green) from tdTomato+ cells (Red). Time-lapse images are shown of DNA that was released in the form of punctate particles (e) or mesh-like structures (f). Scale bar, 20 μm. 5 μm (enlarged). Representative of two independent experiments. g Quantitative analysis of PE-Ly6G+SG+ cells/10 min in kidney of PIL and Gsdmd−/− mice by intravital imaging. n = 6 mice. Representative of three independent experiments. Data are presented as mean ± SD. Significance was examined with unpaired two-sided Student’s t test (b, d, g).

