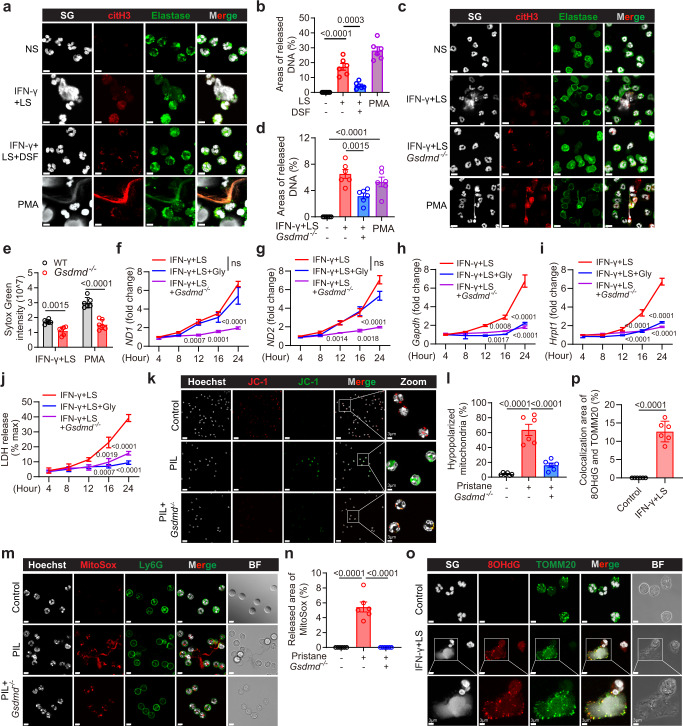
Fig. 3. GSDMD is required for the release of NET-associated DNA and mtDNA following lupus serum treatment.
a Immunofluorescence staining of citH3, elastase, and Sytox Green (SG). Cells were treated with normal serum (NS) from HV, LS from SLE patients plus IFN-γ, pretreated with DSF, or PMA. Scale bar, 5 µm. b Quantitative analysis of areas of released DNA in (a). Symbols represent the percentage of extracellular DNA area as compared to the entire FOV. Two healthy donors were used in one experiment, plots were pooled from three independent experiments using cells from 6 healthy donors. c Immunofluorescence staining of SG, citH3 and Ly6G. scale bar, 15 µm. d Quantitative analysis of areas of released DNA in (c). Symbols represent the area percentage of extracellular DNA relative to the entire FOV. e Quantitative analysis of SG intensity in the supernatant collected from WT and Gsdmd−/− BM neutrophils following stimulation with LS plus IFN-γ or PMA. qPCR analysis of mitochondrial-encoded gene ND1 (f) and ND2 (g), nuclear-encoded gene, Gapdh (h) and Hrpt1 (i) in the supernatant. n = 3 mice. j Quantification of LDH in the supernatant from the indicated treatment groups. n = 3 mice. k Immunofluorescence staining of JC-1 in neutrophils from WT, PIL mice, and Gsdmd−/− mice after pristane treatment. Scale bar, 20 µm. 3 μm (enlarged). l Quantification of hypopolarized mitochondria in (k). n = 6 mice. m Immunofluorescence staining of MitoSox and Ly6G from WT, PIL mice, and Gsdmd−/− mice after pristane treatment. Scale bar, 5 µm. n Quantitative analysis of areas of released MitoSox in (m). n = 6 mice. o Immunofluorescence staining of SG, 8OHdG, and TOMM20 in neutrophils stimulated with LS + IFN-γ for 8 h; scale bar, 5 µm. 3 μm (enlarged). p Quantification of co-localization area of 8OHdG and TOMM20 in o. The results are pooled from two independent experiments using cells from 6 mice (d, e, p). Three independent experiments (f–j, k–n). Data are shown as mean ± SD. Significance was examined by one-way ANOVA (b, d, l, n), unpaired two-sided Student’s t test (e–j, p).

