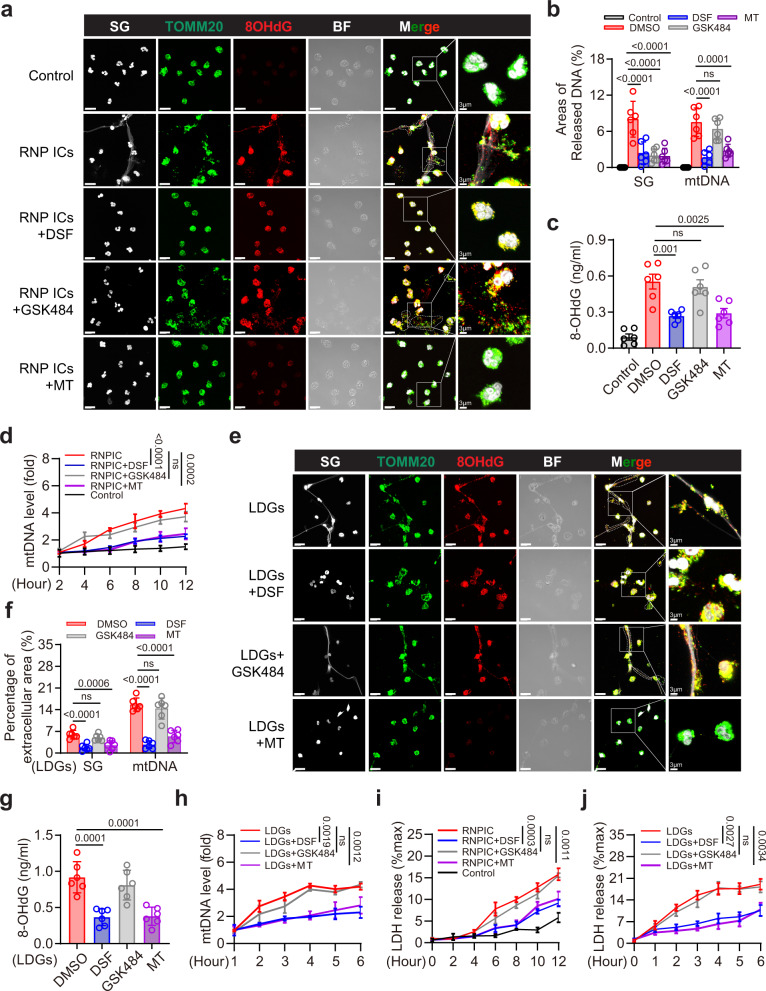
Fig. 4. RNP ICs-induced release of extracellular mtDNA is significantly suppressed by mROS and GSDMD inhibition.
a Immunofluorescence staining of SG, TOMM20 and 8OHdG in peripheral blood neutrophils from HV after RNP ICs treatment. Cells were pretreated with DSF (5 µM), GSK484 (10 µM), or Mito-TEMPO (10 µM) for 2 h, followed by stimulation for 12 h with RNP ICs. BF: bright field; scale bar, 15 µm. 3 μm (enlarged). b Quantitative analysis of areas of extracellular SG and mtDNA in (a). Areas of released mtDNA including regions of extracellular TOMM20/8OHdG positive staining. c Quantification of 8OHdG content in culture medium after the indicated treatment. d Quantitative analysis of mtDNA into the supernatant from the indicated treatment groups at the indicated time points by qPCR. n = 3 HVs. e Immunofluorescence staining of SG, TOMM20 and 8OHdG in LDGs after 6 h. LDGs were pretreated with DSF (5 µM), GSK484 (10 µM) or Mito-TEMPO (10 µM). Scale bar, 15 µm. 3 μm (enlarged). f Quantitative analysis of areas of extracellular SG and mtDNA in (e). g Quantification of 8OHdG content in cultured medium of LDGs. h Quantification of the released mtDNA in LDGs at the indicated time points. n = 3 SLE patients. i, j Quantification of the release of LDH into the supernatant from the indicated groups at the indicated time points by ELISA. n = 3 HVs (i) and 3 SLE patients (j). The results are pooled from three independent experiments using cells from 6 HVs (b, c). Two SLE patients were used in one experiment, and plots were pooled from three independent experiments using cells from 6 SLE patients (f, g). Representative of three independent experiments (a, d, e, h, i, j). Data are presented as mean ± SD. Significance was examined by one-way AVOVA (b, c, f, g) or unpaired two-sided Student’s t test (d, h, i, j).

