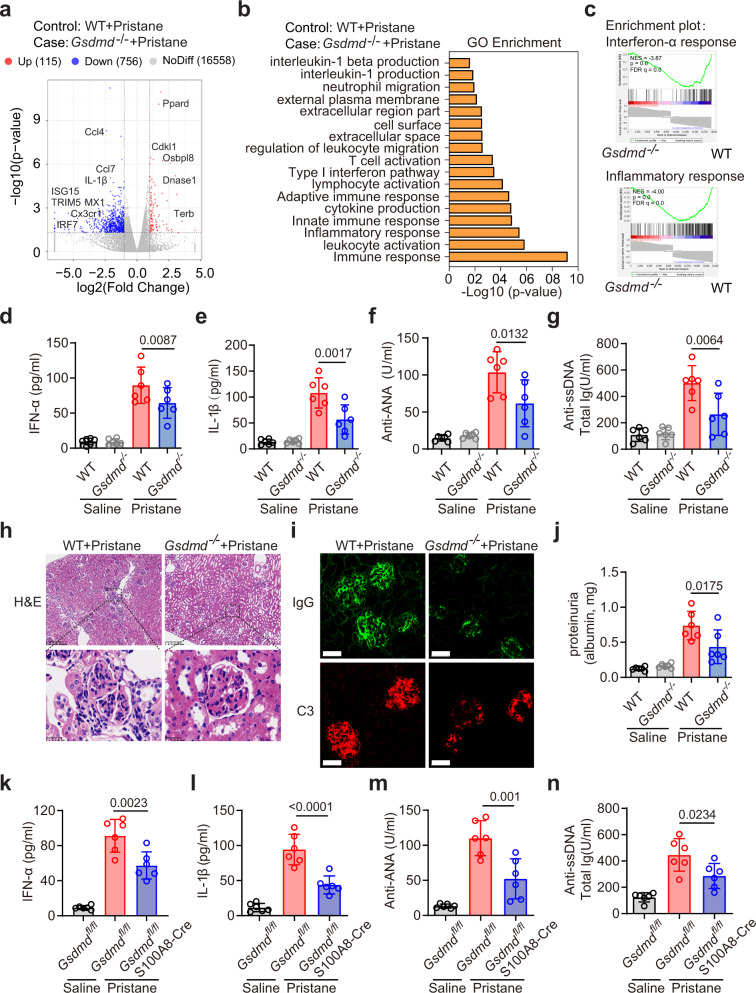
Fig. 8. GSDMD deficiency significantly reduced disease activity in PIL mice.
a Volcano plots were prepared demonstrating the distributions of P-values [−log10 (P value)] and fold change values [log2 (fold change)]. Down- and upregulated genes are shown in blue and red respectively. b Differential gene expression in kidneys from PIL mice relative to pristane-treated Gsdmd−/− mice. GO enrichment analysis demonstrating the biological processes most significantly enriched in the kidneys of WT and Gsdmd−/− mice following pristane treatment. c GSEA approaches identifying genes associated with IFN-α response and inflammatory response between WT and Gsdmd−/− mice following pristane treatment. ELISA analysis of serum IFN-α (d), IL-1β (e), anti-ANA (f) and anti-ssDNA (g) levels from the indicated groups. h H&E staining of glomeruli from WT and Gsdmd−/− mice following pristane treatment. Scale bar, 200 μm, 25 μm (enlarged). i Immunofluorescence of IgG (green) and complement C3 (red) in kidney section from WT and Gsdmd−/− mice after pristane treatment. Scale bar, 25 μm. j ELISA analysis of urine albumin levels in WT and Gsdmd−/− mice after pristane treatment. ELISA analysis of IFN-α (k), IL-1β (l), anti-ANA (m) and anti-ssDNA (n) antibodies in serum from Gsdmdfl/fl or Gsdmdfl/flS100A8-Cre mice after pristane treatment for 7 months. NES normalized enrichment score, FDR false discovery rate. n = 6 mice (d–g, j–n) and data are representative of 2 independent experiments (d–n). Data are shown as means ± SD. Significance was examined with one-way ANOVA (d–g, j–n).

