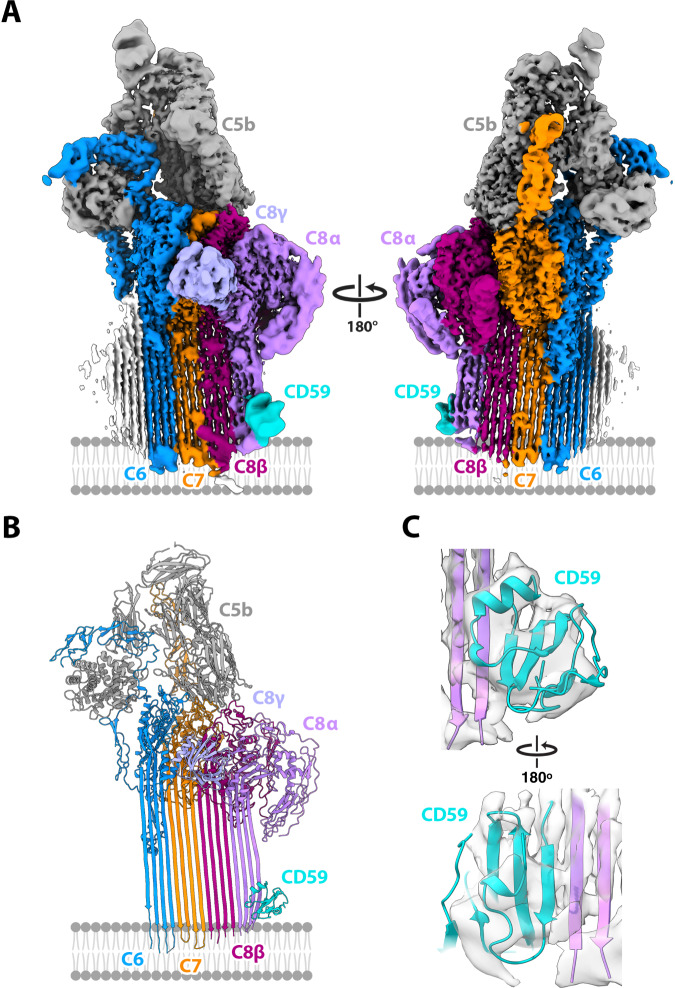
Fig. 2. Structure of the C5b8-CD59 complex.
CryoEM map A and model B for the C5b8-CD59 nanodisc complex. Complement proteins are colored (C5b, grey; C6, blue; C7, orange; C8α, pink; C8β, magenta; C8γ light purple). CD59 is cyan. The membrane, not visible in the sharpened map, is schematized for reference. To improve the resolution for CD59, the density for C5b, C6 and C8γ was subtracted from the consensus map (A) and refined. C Model for CD59 and interaction interface with C8α overlayed on the density subtracted focus refined map.

