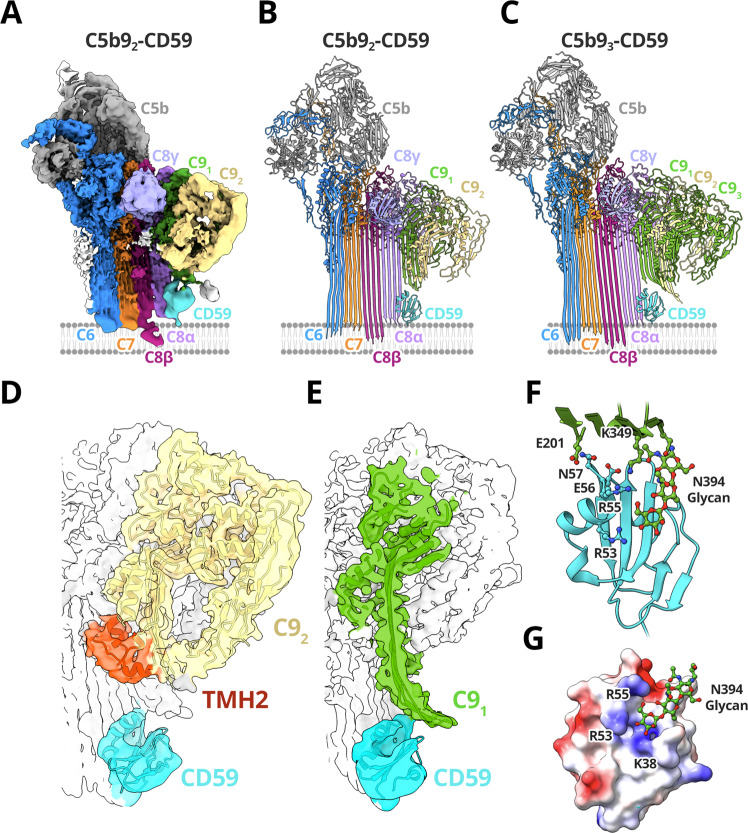
Fig. 4. Structure of the C5b9-CD59 complex.
CryoEM map A and model B of C5b9-CD59 complexes comprised of 2 molecules of C9 (C91 and C92). (C) A model for the C5b9-CD59 complex comprised of 3 C9 molecules. Complement proteins are colored (C5b, grey; C6, blue; C7, orange; C8α pink, C8β magenta, C8γ light purple); CD59 is cyan. The membrane, not visible in the sharpened map, is schematized for reference. D, E Density for the C5b92-CD59 map after density subtraction and focused refinement (transparent surface) overlayed with the model. D For the terminal C9 (C92, yellow), only the first transmembrane β-hairpin has unfurled while TMH2 (red) remains helical. E CD59 (cyan) deflects both TMH1 and TMH2 from the first C9 (C91, green) to block membrane insertion. F The C91-CD59 interaction interface. The key residues that mediate interactions are shown as sticks. G Electrostatic surface representation of CD59 highlighting positively charged residues (R55, R53, K38) that interact with the C9 glycan extending from N394 (green sticks). Coulombic potential calculated for the CD59 model in B ranging from −10 (red) to +10 (blue) kcal/(mol·e).

