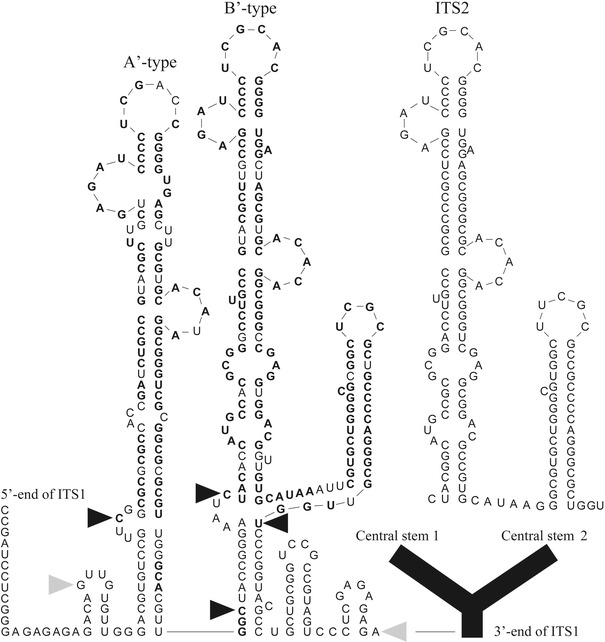
Fig. 3.

Secondary structure prediction of a 5′-subrepeat from An. irenicus showing the dual A- and B-type repeats and their ITS2 paralogue (inset) (GenBank accession no. EF042725). Identical nucleotides between the ITS structures are shown in boldface for both ITS1 repeats. Black arrows show the sequence match boundaries to the ITS2 structure. Gray arrows denote the beginning and end of the dual repeat. The downstream ITS1 sequence, or ‘core’ region, is drawn in black as a generalized Y-shaped structure with two long central stems
