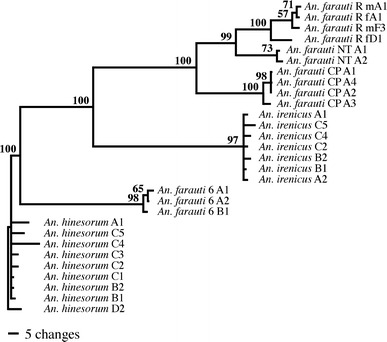
Fig. 5.

Phylogram showing phylogenetic relationships of the ITS1 (50% majority-rule consensus tree from 500 bootstrap replicates using ML analysis) from a sample of the An. farauti complex. Bootstrap proportions are shown above each node of the phylogram and branch lengths are proportional to the number of changes (see scale bar). Individuals are denoted ‘A’ to ‘F’ after species name, and clones are numbered 1 to 5. The An. farauti populations are denoted R = Rabaul (wherein m = male and f = female), NT = Northern Territory, and CP = Central Province
