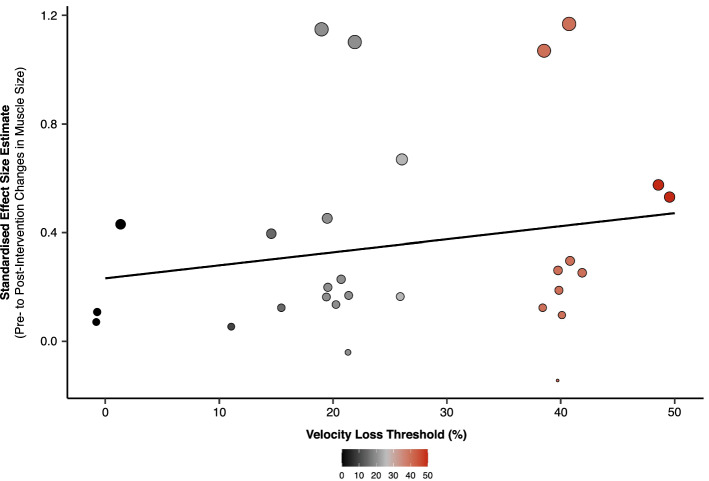
Fig. 4.
Individual standardised effect sizes (pre-intervention to post-intervention changes in muscle size) for all velocity loss conditions [low (< 20%), moderate (20–25%), high (> 25%)] in each study from Theme C. Data presented were extracted from studies grouped into Theme C that involved resistance training performed to different velocity loss thresholds. The size of the dot point is based on a standardised effect size and a horizontal ‘jitter’ was applied to limit the overlap of dot points (as such, the dot point position on the x-axis is not a true representation of the velocity loss achieved and is rather limited to 0, 10, 15, 20, 25, 40 and 50% velocity losses). Positive effect size values indicate increases in muscle size from pre-intervention to post-intervention for each velocity loss condition

