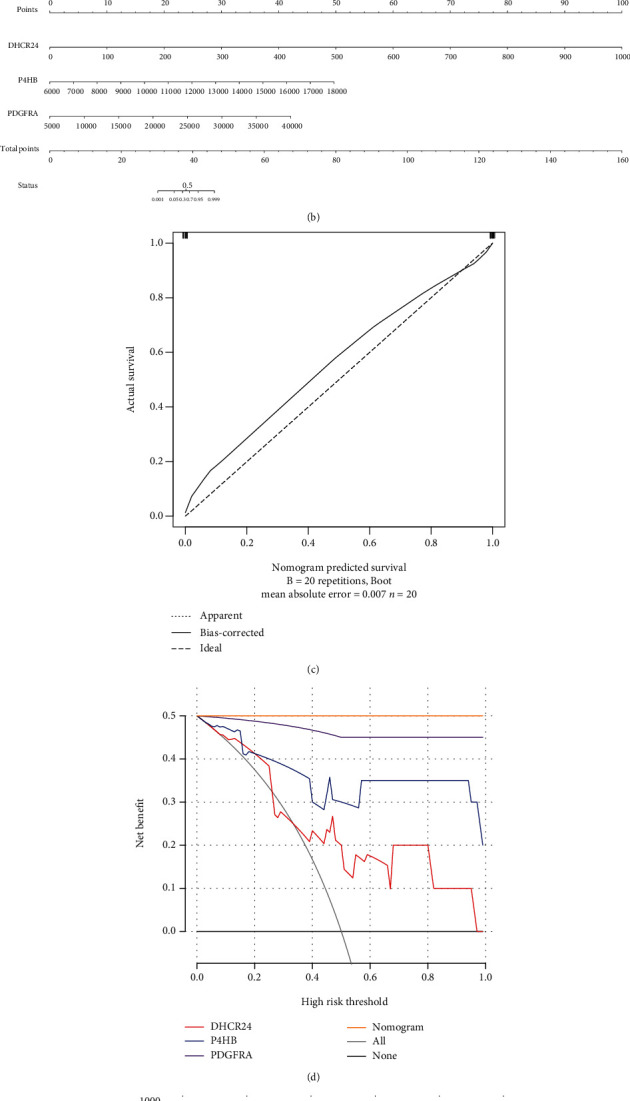
Figure 7.

Identification of key m6A oxidative stress-related genes. (a) Boxplot of expression of key m6A oxidative stress-related genes in GSE153434: “∗” means P < 0.05, “∗∗∗” means P < 0.001, and “∗∗∗∗” means P < 0.0001. (b) Nomo-diagram-logistic model. (c) Calibration curve analysis. (d) Decision curve analysis. (e) Clinical impact analysis.
