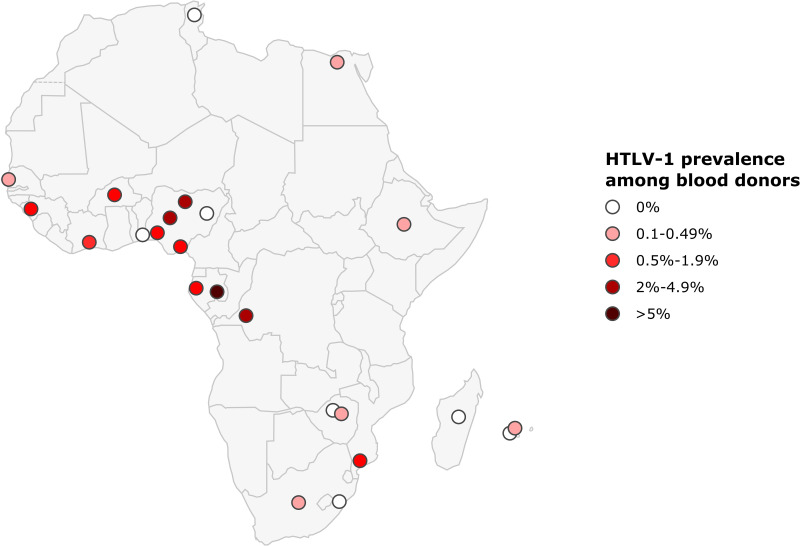
Figure 5.
Map of Africa showing location and results of HTLV-1 prevalence studies among blood donors. The range of HTLV-1 prevalence is indicated by color of red gradient. In case of great geographical or inter-studies variations in prevalence within a country, each result was represented separately at the site of the study location (when available).

