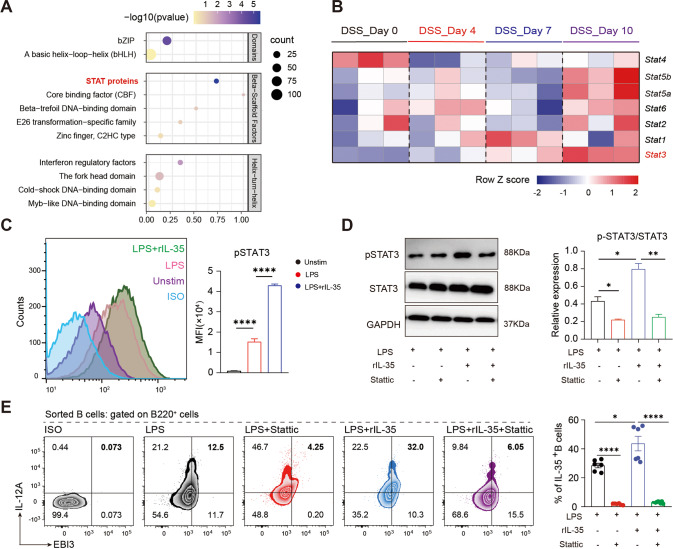
Fig. 6. Autocrine action of IL-35 producing B cells depends on the STAT3 pathway.
A Bubble diagram shows transcription factor enrichment analysis ranked by significance in CD19+ B cells isolated from Peyer’s patches of colitis induced mice at day 0, 4, 7, and 10 post-disease onset (n = 6 per group). B Heatmap shows the expression of the STAT family proteins in CD19+ B cells isolated from Peyer’s patches of colitis induced mice at day 0, 4, 7, and 10 post-disease onset. Data are normalized and shown in the format of transcripts per million. Genes that are highly correlated with the expression levels of IL-35 in colitis are highlighted (n = 6 per group). C The expression of p-STAT3 in CD19+ B cells after 72 h stimulation with or without rIL-35 are shown as mean fluorescence intensity (MFI) (n = 3 per group). Bar graphs represent the MFI of the groups (right panel). D Western blot of B cells stimulated under IL-35 producing B cells culture conditions with or without 10 nM STAT3 inhibitor (stattic, 10 ng/mL) (n = 3 per group). E Percentage of IL-35 producing B cells (B220+ IL-12A+ EBI3+ cells) under IL-35 producing B cells culture conditions with or without 10 nM STAT3 inhibitor (stattic) was detected by flow cytometry (lipopolysaccharide (LPS) group n = 6; LPS + rIL-35 group n = 6; LPS + stattic group n = 6; LPS + rIL-35+stattic group n = 9). C–E Two-tailed unpaired Student’s t-test. Data are shown as mean ± standard error of the mean (SEM) and are representative of at least three independent experiments (*P < 0.05, **P < 0.01, ***P < 0.001, ****P < 0.0001).

