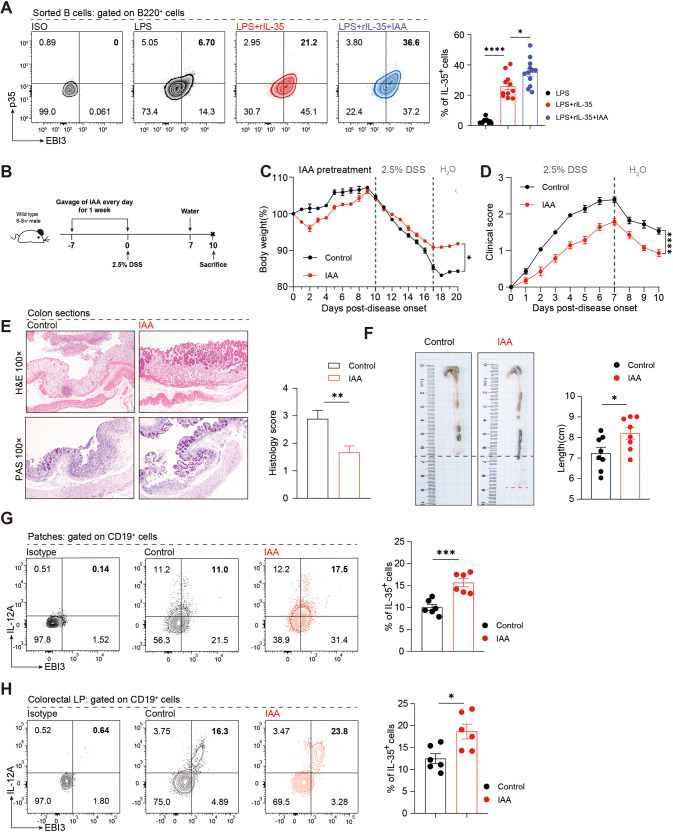
Fig. 8. Supplementation with IAA suppresses colitis by skewing the B cell compartment in favor of an IL-35 producing B cell phenotype.
A Percentage of IL-35 producing B cells (B220+ IL-12A+ EBI3+) in B cells with or without 1000 nM IAA treatment was detected by flow cytometry (lipopolysaccharide (LPS) group n = 12; LPS + rIL-35 group n = 11; LPS + rIL-35+IAA group n = 12). Bar graphs represent the frequencies of IL-35 producing B cells in the groups (right panel). B Wildtype (WT) mice were gavaged with IAA daily 1 week prior to the induction of colitis and throughout the experiment. C Body weight was calculated (n = 4 per group). D Disease activity index (DAI) was calculated (n = 7 per group). E Representative colon sections stained with hematoxylin and eosin (upper panel) and periodic acid-Schiff (lower panel) are shown for each group. Images are shown at ×100 magnification (n = 8 per group). F Representative colon sections are shown for each group. Length of the colon is shown on the bar graph (n = 9 per group). G, H Cells were isolated from Peyer’s patches (Patches) G (n = 6 per group) and lamina propria (LP) (H) (n = 6 per group) of the control or IAA treatment group and the percentage of the IL-35-producing B cells (CD19+ IL-12A+ EBI3+) in B cells was determined by flow cytometry. C, D Two-way analysis of variance (ANOVA) with Dunnett’s multiple comparisons test. A, E–H Two-tailed unpaired Student’s t-test. Data are shown as mean ± standard error of the mean (SEM) and are representative of at least three independent experiments (*P < 0.05, **P < 0.01, ***P < 0.001, ****P < 0.0001).

