Fig. 9.
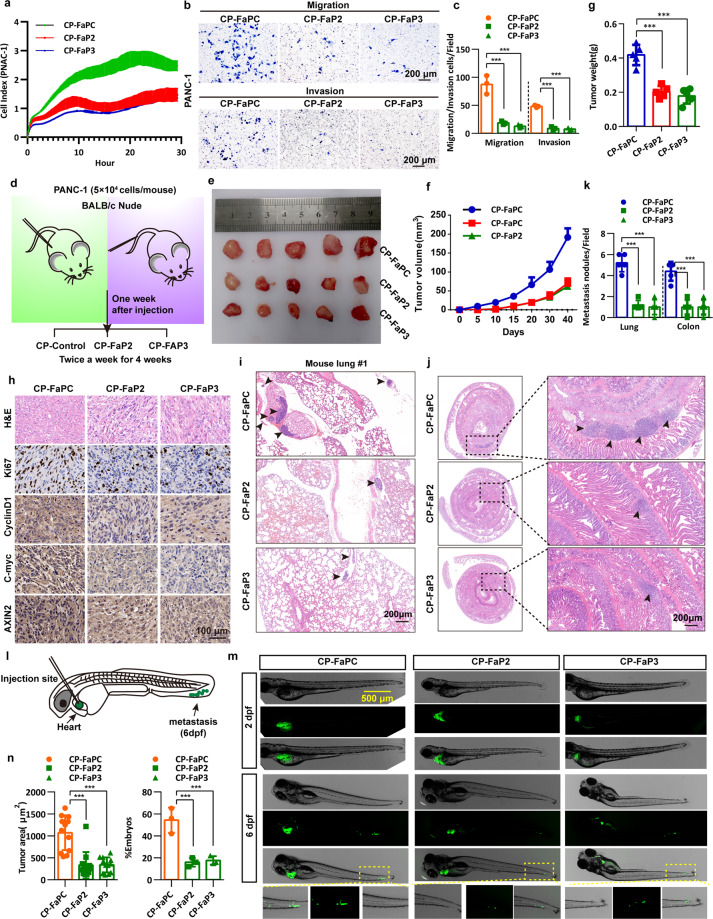
FAM83A-β-catenin interaction inhibitory peptides restrain pancreatic cancer development. a Real-time cell analysis (cell index, CI) showing the differences in growth profile for PANC-1 cells treated with control (CP-FaPC, 2 mg/kg/2d), CP-FaP2 (2 mg/kg/2d), and CP-FaP3 (2 mg/kg/2d) peptides measured in a 16-well E-plate. b, c Representative images and quantification of the transwell assays with or without matrigel of PANC-1 cells treated with control, CP-FaP2, and CP-FaP3 peptides (n = 3). d Schematic diagram of the experimental procedure of the treatment of the peptides to nude mice xenograft formation and tail vein injection. e Representative images of excised tumors in the groups with respective peptides treatment were shown. f The growth curve shows the changes in the tumor volume in mice in different groups (n = 5). g Weight of the excised tumors in each group (n = 5). h Representative H&E staining images and immunohistochemical images of Ki67, C-myc CyclinD1, and AXIN2 expression in excised tumors tissues. i–k Representative images and quantification of lung and colon metastasis of each group was shown (n = 5). l Schematic diagram of the zebrafish embryo xenograft assay. m Representative overview images at two days and six days post-implantation of zebrafish injected with EGFP-tagged PANC-1 cells. Scale bar: 500 μm. n Quantification of the area of metastatic cells in individual zebrafish embryos (n = 15) and the percentage of the zebrafish embryos displaying tumor progression to the tail fin (n = 3)

