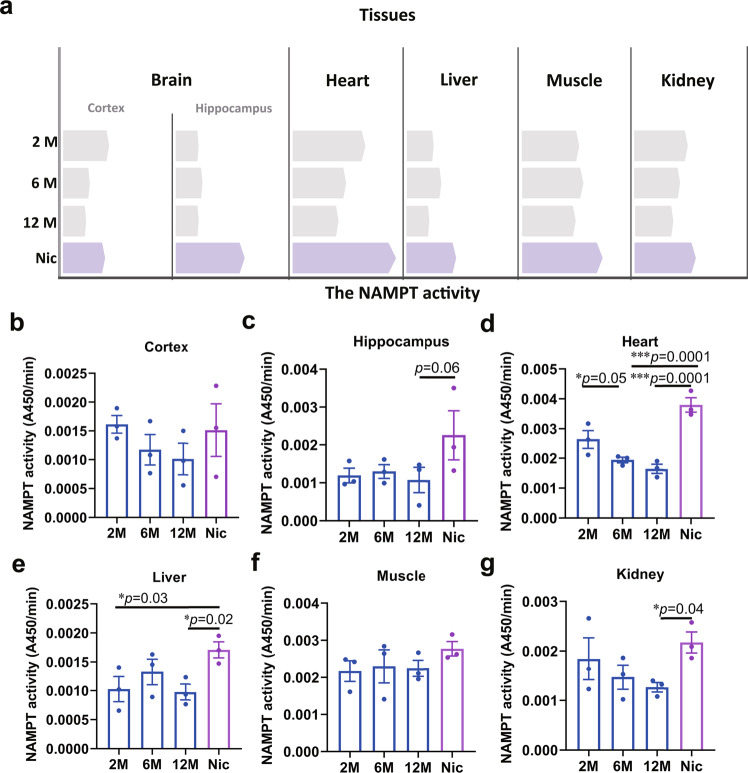
Fig. 1. Nicotine enhanced NAMPT activity in aged mice.
a Schematic diagram of the changes in NAMPT activity and nicotine enhancing NAMPT activity in various tissues (the bars represent the mean value of NAMPT activity). Statistical diagram of NAMPT activity change of different tissues: b Cortex, c Hippocampus, d Heart, e Liver, f Muscle, g Kidney. Data are means ± SEM (n = 3, biologically independent samples/group); p values were determined by one-way ANOVA with Tukey’s multiple comparisons test (b–g).

