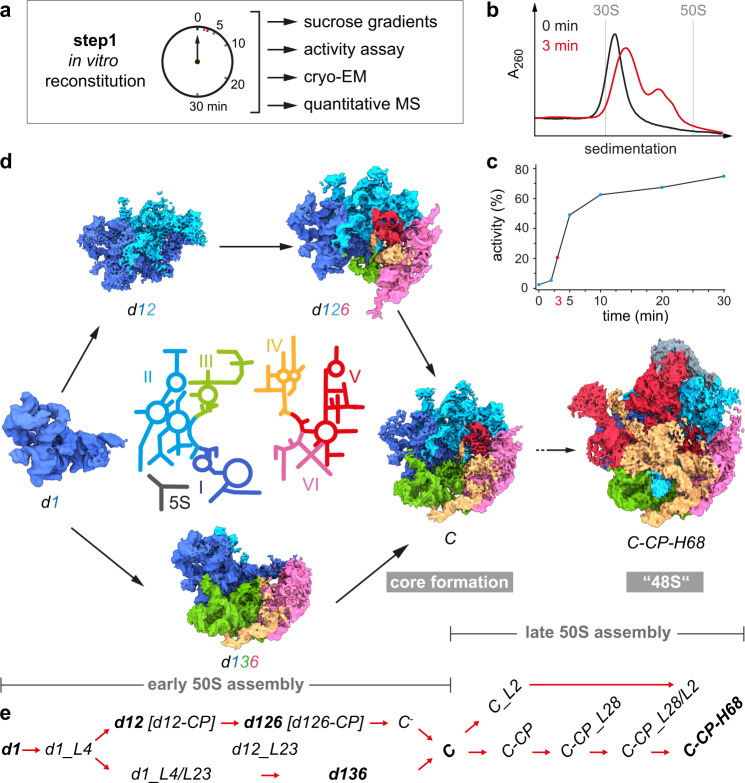
Fig. 1. Time course of 50S step 1 in vitro reconstitution with structural and biochemical analyses.
a Experimental setup. b Sucrose gradient profiles of in vitro reconstitution samples incubated for 0 min (black) or 3 min (red), respectively. c In vitro translation assay indicating the relative activity of subunits after the indicated time of incubation under step 1 conditions plus subsequent incubation under step 2 conditions for 90 min. Data are presented as mean values based on n = 2 technical replicates. d In the center, a color-coded 2D map of the 23S rRNA with the individual domains labeled from I–VI (5S, 5S rRNA). Cryo-EM maps of selected states derived from the step 1 reaction after 3 min of incubation appear in the same color-code. e Nomenclature for states occurring during early and late 50S assembly. States in bold are shown in (d). d, 23S rRNA domain; C, 50S core; CP, central protuberance; H68, helix 68. Source data are provided as a Source Data file.

