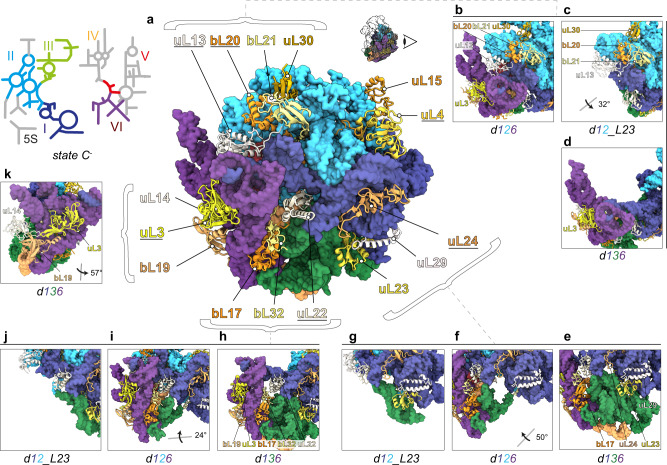
Fig. 2. Clustering of L-proteins.
a 2D rRNA map and atomic model of state C- in back view. L-proteins appear as cartoons (early essential proteins and uL3 are underlined), rRNA as surface model (lowpass-filtered to 5 Å resolution). Presence and absence of bL21, bL20, and uL30 in states d126 (b), d12 (c), and d136 (d), respectively. Presence and absence of uL23 in states d136 (e), d126 (f), and d12 (g), respectively. Presence and absence of bL17, bL32, and uL3 and bL19 in states d136 (h), d126 (i), and d12 (j), respectively. Positions of uL14, uL3 and bL19 in state d136 (k). Viewing angles in (c, f, i, and k) are shown relative to the full model in a).

