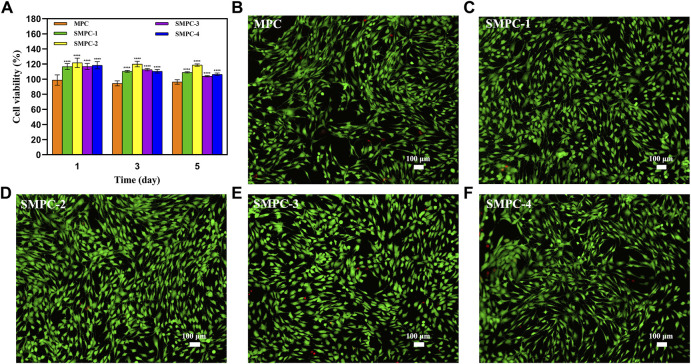
FIGURE 4.
(A) Results of CCK-8 assays of BMSC bioactivities in the presence of MPC and the SMPCs after culturing for 1, 3, and 5 d. Data are presented as mean ± SD (****p <0.0001; vs. MPC). (B–F) Fluorescence microscope images of 4′,6-diamidino-2-phenylindole and calcein acetoxymethyl ester stained BMSCs cultured in the presence of MPC and the SMPCs for 5 d (green: viable cells; red: dead cells).

