FIGURE 6.

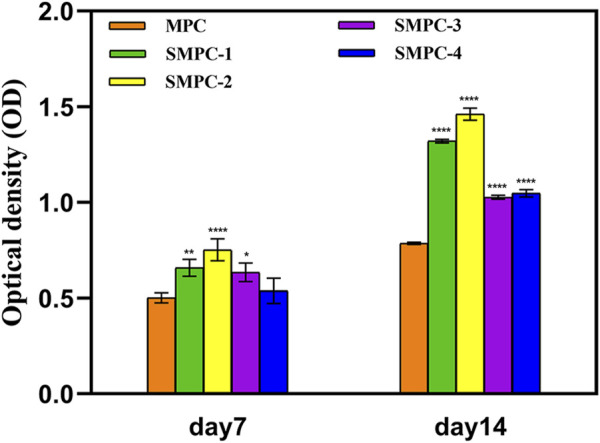
ALP activities in the form of optical densities in assays of BMSCs cultured for 7 and 14 d in the presence of MPC and the SPMCs. Data are presented as mean ± SD (*p <0.05; **p <0.01; ****p <0.0001; vs. MPC).

ALP activities in the form of optical densities in assays of BMSCs cultured for 7 and 14 d in the presence of MPC and the SPMCs. Data are presented as mean ± SD (*p <0.05; **p <0.01; ****p <0.0001; vs. MPC).