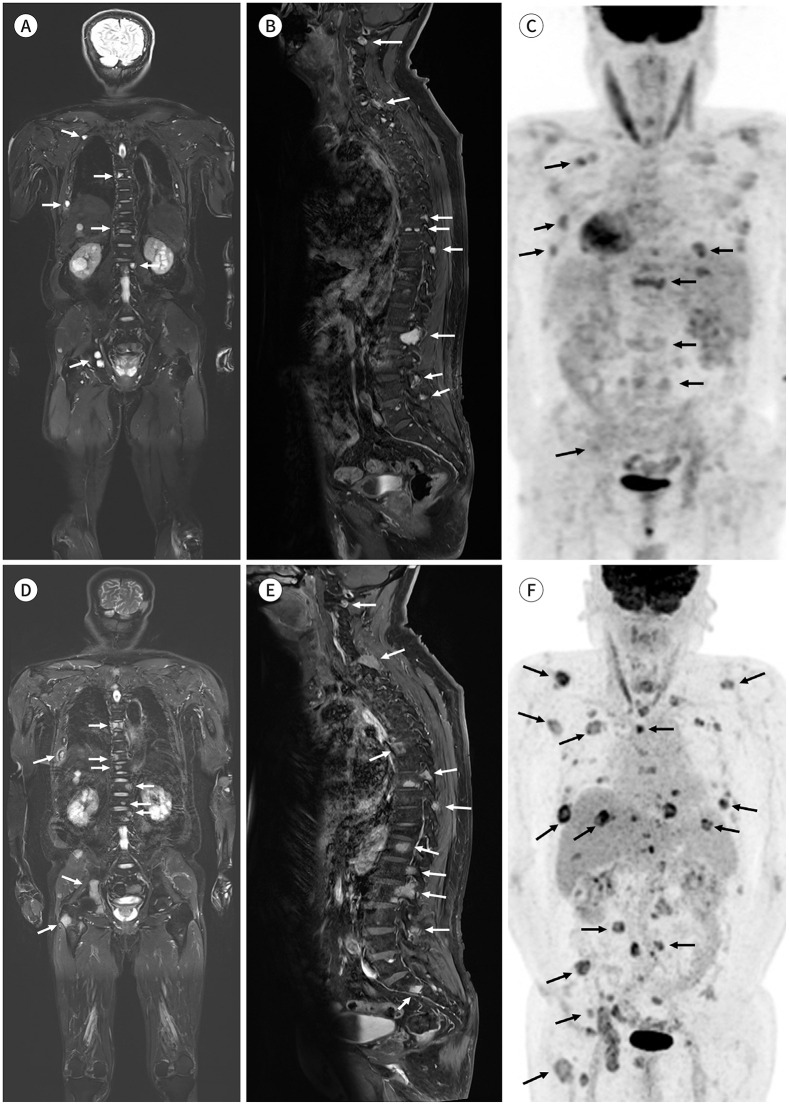
Fig. 5. A 63-year-old male patient with multiple myeloma.
A-C. Initial coronal fat-suppressed T2-weighted (A) and sagittal contrast-enhanced fat-suppressed T1-weighted images (B) show multifocal bone marrow lesions (white arrows). A PET/CT performed at around the same time (C) shows multifocal hypermetabolic bone lesions (black arrows).
D-F. Coronal fat-suppressed T2-weighted (D) and sagittal contrast-enhanced fat-suppressed T1-weighted images (E) and PET/CT image (F) acquired at 1 year and 4 months of follow-up after chemotherapy initiation show an increased size and a high number of multifocal bone marrow lesions in the whole skeleton (arrows). According to the response assessment category of MY-RADS, the lesion appears category 5 and is highly likely to be progressing. Progression of the disease is visible on whole-body MRI, similar to that on PET/CT.

