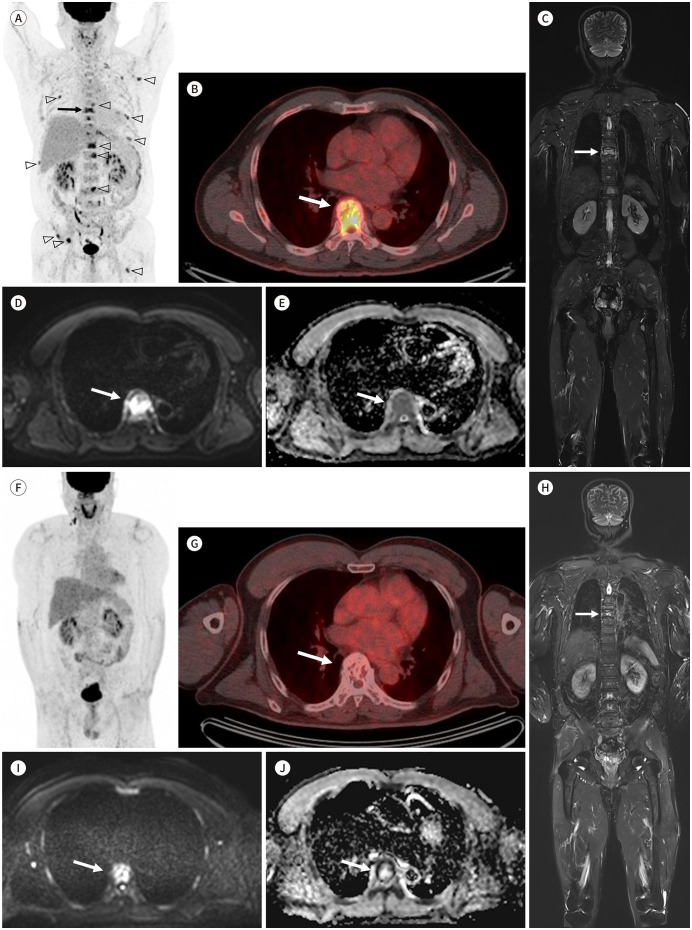
Fig. 6. A 64-year-old male patient with multiple myeloma.
A-E. Initial PET/CT images (A, B) show multiple hypermetabolic bone lesions (arrowheads) in the skeleton, including at the T7, with pathologic compression fracture (arrows). Coronal fat-suppressed T2-weighted image (C) shows a lesion with high signal intensity at T7 (arrow). A high b-value image (D, b = 900 sec/mm2) shows a high signal intensity lesion at T7 (arrow), and the apparent diffusion coefficient map (E) shows a higher apparent diffusion coefficient value (arrow) than that of the normal bone marrow.
F-J. PET/CT images (F, G) acquired at 1-year follow-up after chemotherapy show no residual hypermetabolic lesions, suggesting complete response (category 1; highly likely to be responding according to the response assessment category from MY-RADS). In the coronal fat-suppressed T2-weighted image (H), a lesion with high signal intensity is still visible in T7 (arrows). However, the diffusion-weighted image (I, b = 900 sec/mm2) and apparent diffusion coefficient map (J) show no diffusion restriction, indicating a treated lesion (arrows).

