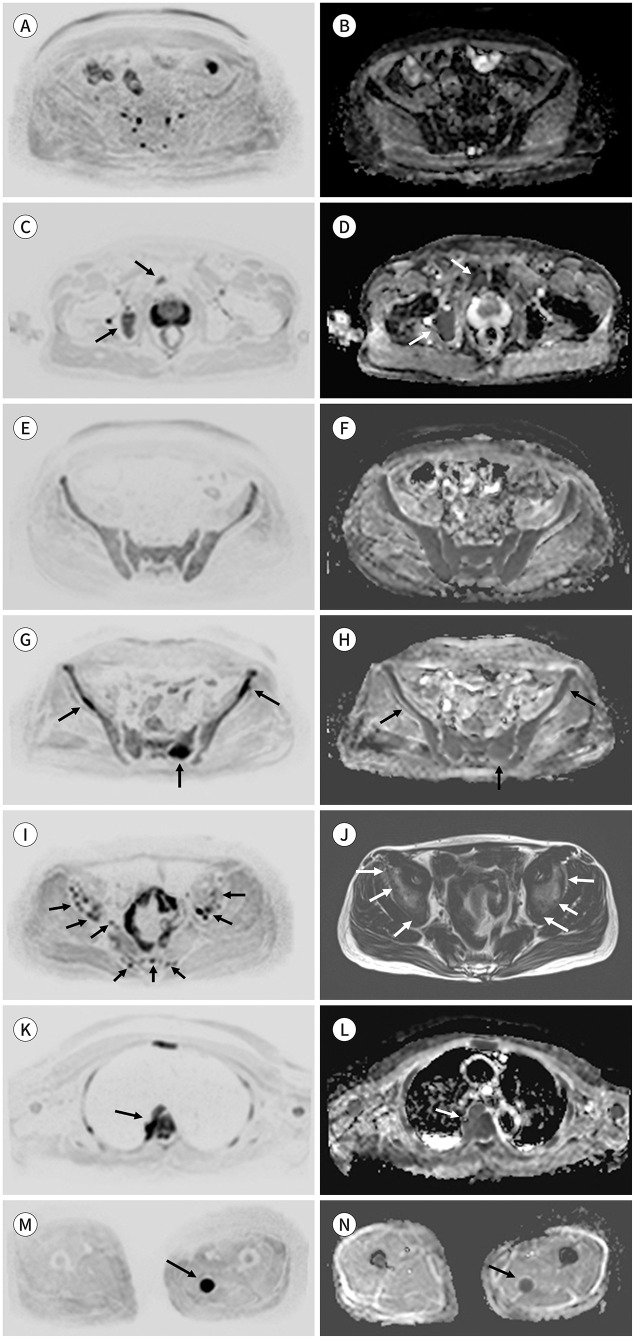
Fig. 7. Patterns of multiple myeloma.
A-H. Axial inverted DWI (b-value = 900 s mm2) (A, C, E, G, I). Corresponding to the ADC maps (B, D, F, H).
A, B. Normal adult bone marrow.
C, D. Focal pattern. Images demonstrate focal bone lesions greater than 5 mm (arrows), which have a higher signal intensity, with high b-value, than the muscle and background marrow, as well as a higher ADC value than the background bone marrow.
E, F. Diffuse pattern. A high b-value image (E) shows a more diffuse, higher signal intensity than muscle, and the corresponding ADC map (F) shows a higher signal intensity than that of the normal bone marrow.
G, H. Focal diffuse pattern. DWI (G) shows focal bone lesions (arrows) with a higher signal intensity than the muscle. However, the background marrow has a higher signal intensity than that of the muscle, and the corresponding ADC (H) shows a higher signal intensity than that of the normal bone marrow.
I, J. Micronodular patterns. DWI (I) and T1-weighted Dixon fat-only images (J) show multiple small nodular signal changes (≤ 5 mm).
K, L. The images show a paramedullary soft-tissue disease with direct continuity with the bone marrow lesion (arrows).
M, N. The images show an extramedullary disease that is not in continuity with bone marrow disease (arrows).
ADC = apparent diffusion coefficient, DWI = diffusion-weighted image

