Figure 5.
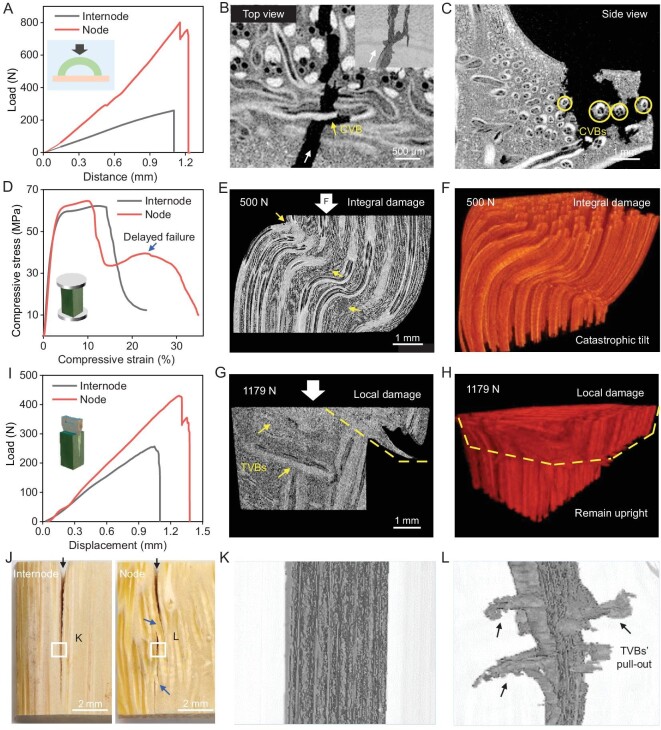
Mechanical studies of CVBs at the peripheral diaphragm and TVBs at the node culm. (A) Compression load-displacement curves of the internode and node-culm-related arched specimens. Inset shows a sketch map. (B and C) Slice projections of the node culm specimen after compression from different view directions. The white arrow (B) shows crack direction, the yellow arrow (B) shows CVB-induced crack deflection. Inset is the reconstructed 3D crack, showing that CVBs can direct crack deflection and bifurcation. Yellow circles (C) indicate the cross sections of CVBs and show their pull-out or fracture. (D) Compression stress-strain curves of the internode culm and node culm, showing delayed failure of the latter. Inset shows a sketch map. (E and F) Slice projection and reconstructed 3D structure of the internode under in-situ compression, showing integral damage. Most AVBs were fractured and PCs were torn (indicated by arrows). (G and H) Slice projection and reconstructed 3D structure of the node culm under in-situ compression. They indicate that the presence of TVBs (indicated by arrows) changes stress transfer mode and enables local damage rather than integral damage. (I) Splitting load-displacement curves of the internode culm and node culm. Inset shows a sketch map. (J) Digital images of the internode culm and node culm after splitting, showing macroscopic cracks. Black arrows show crack directions. Twisted and bridged cracks exist in the node (blue arrows), while a straight crack exists in the internode. (K and L) Reconstructed 3D cracks of the internode culm and node culm after splitting, reflecting extensive pull-out of TVBs (L, arrows).

