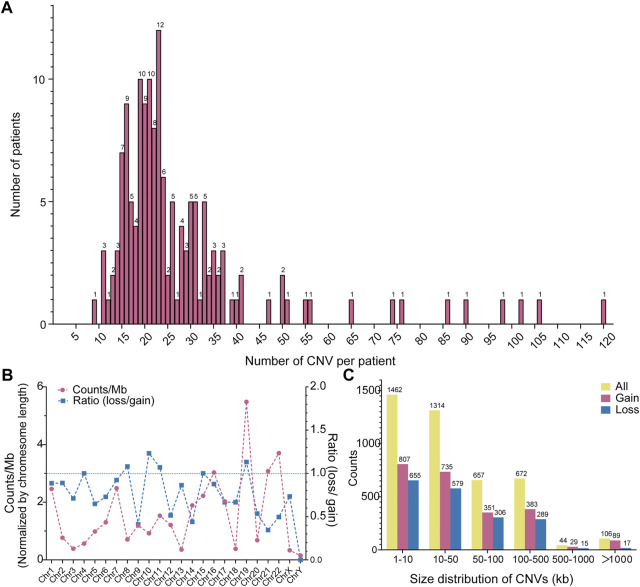
FIGURE 1.
Distribution of CNVs in AVSD. (A) Frequency distribution of CNV counts in each individual. The Y-axis represents the number of patient and the X-axis represents CNV count per individual. (B) Chromosomes distribution of CNVs and the ratio of deletion (loss) and duplication (gain). The red line represents the CNV count of each chromosome, the blue line represents the ratio of loss (deletion) and gain (duplication). (C) Size distribution of CNVs. The yellow, red and blue column indicate all, gain and loss CNV count, respectively. CNV, copy number variation; AVSD, atrioventricular septal defect.

